closegps_fixed

States Gear Up For Severe Threat; Hail, Wind Damage, Tornadoes
A classic springtime setup will ignite bouts of severe storms in the central U.S. beginning Thursday. Here's what to know.

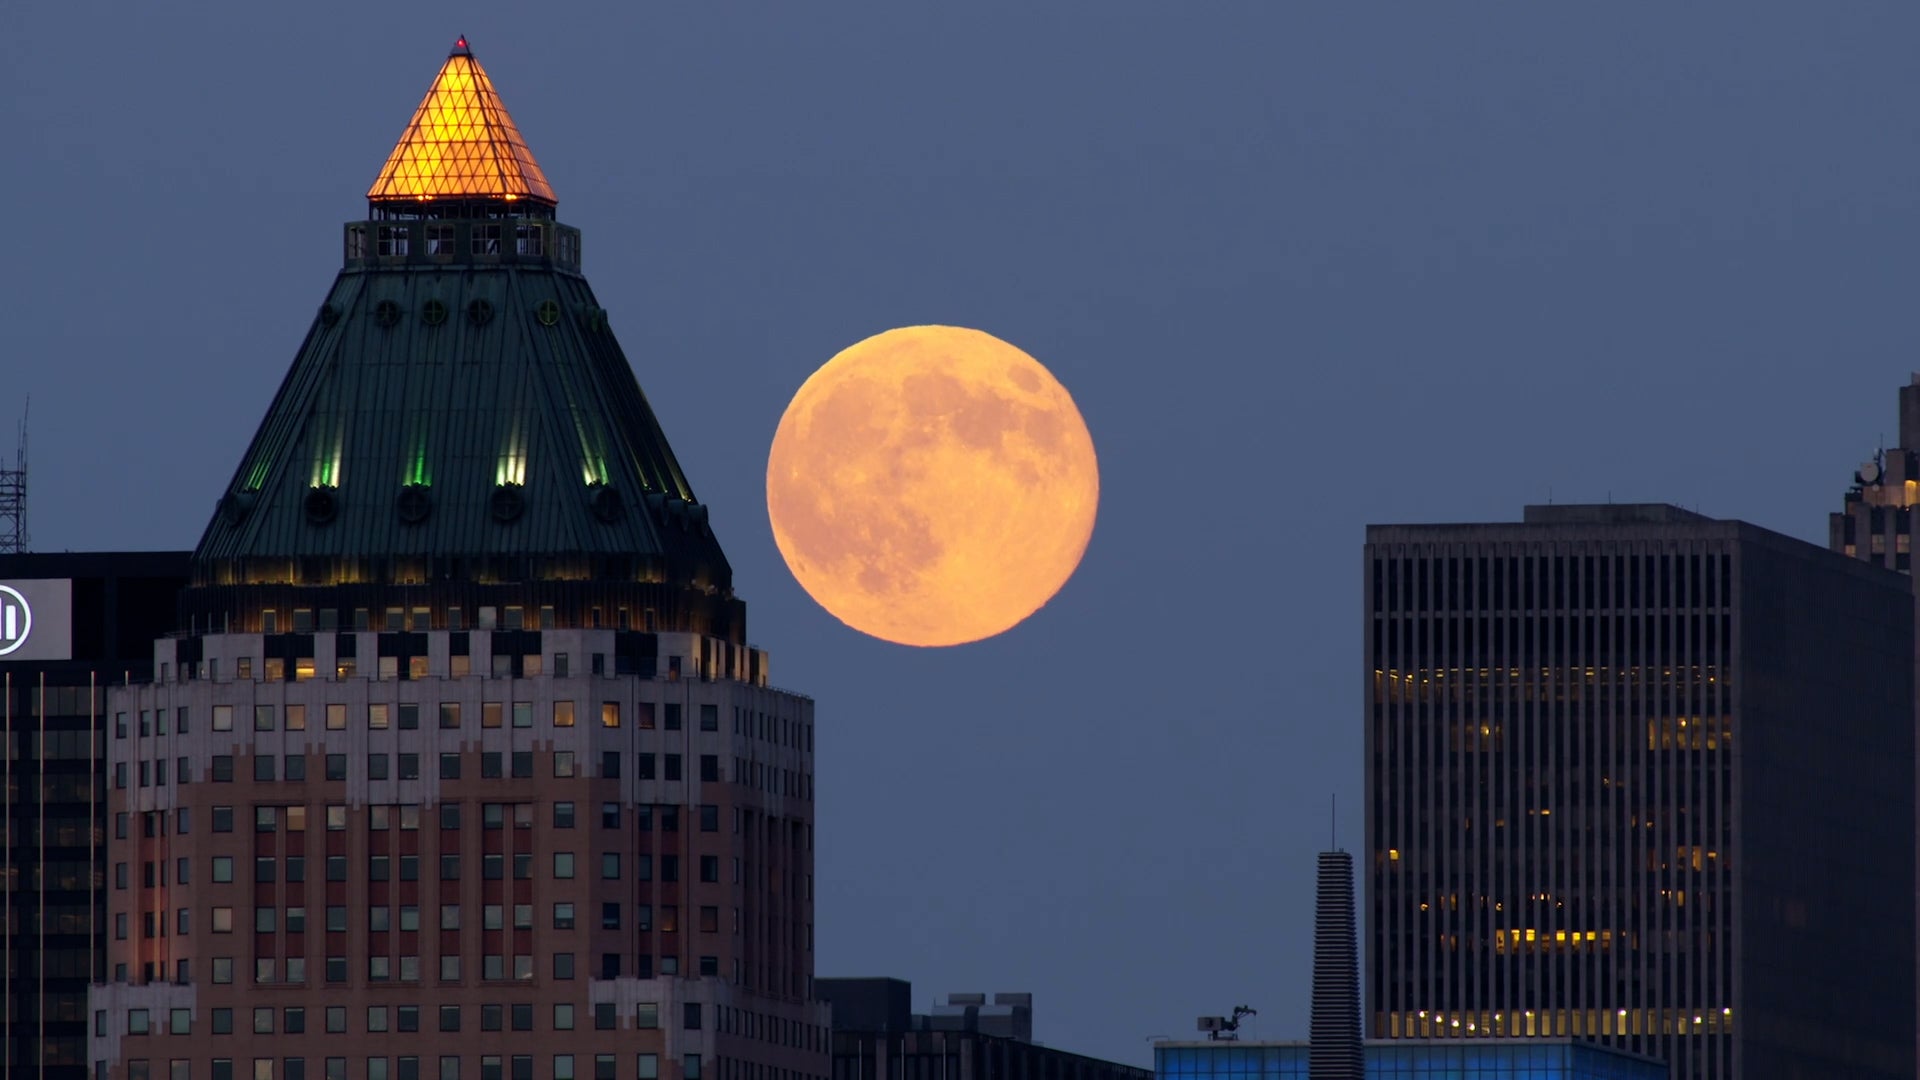
A 'Pink Moon' Is Coming; How To See The Spectacular Event
A full moon rises soon and this one is called a pink moon; find out why and when you can see it this week.
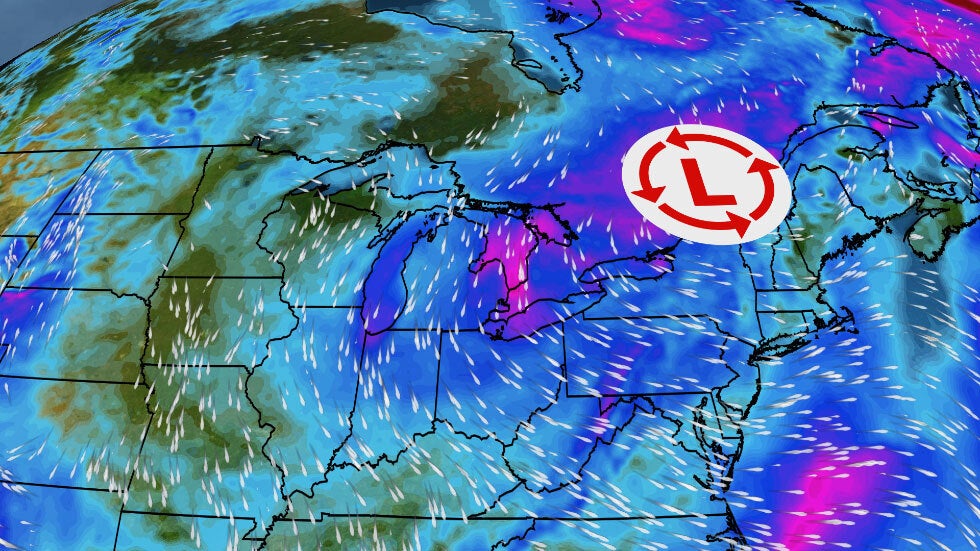
Quick-Moving System Brings Changes To Midwest, Northeast
Rain, gusty winds and a temperature drop will accompany a cold front as it moves through the Midwest and Northeast midweek.
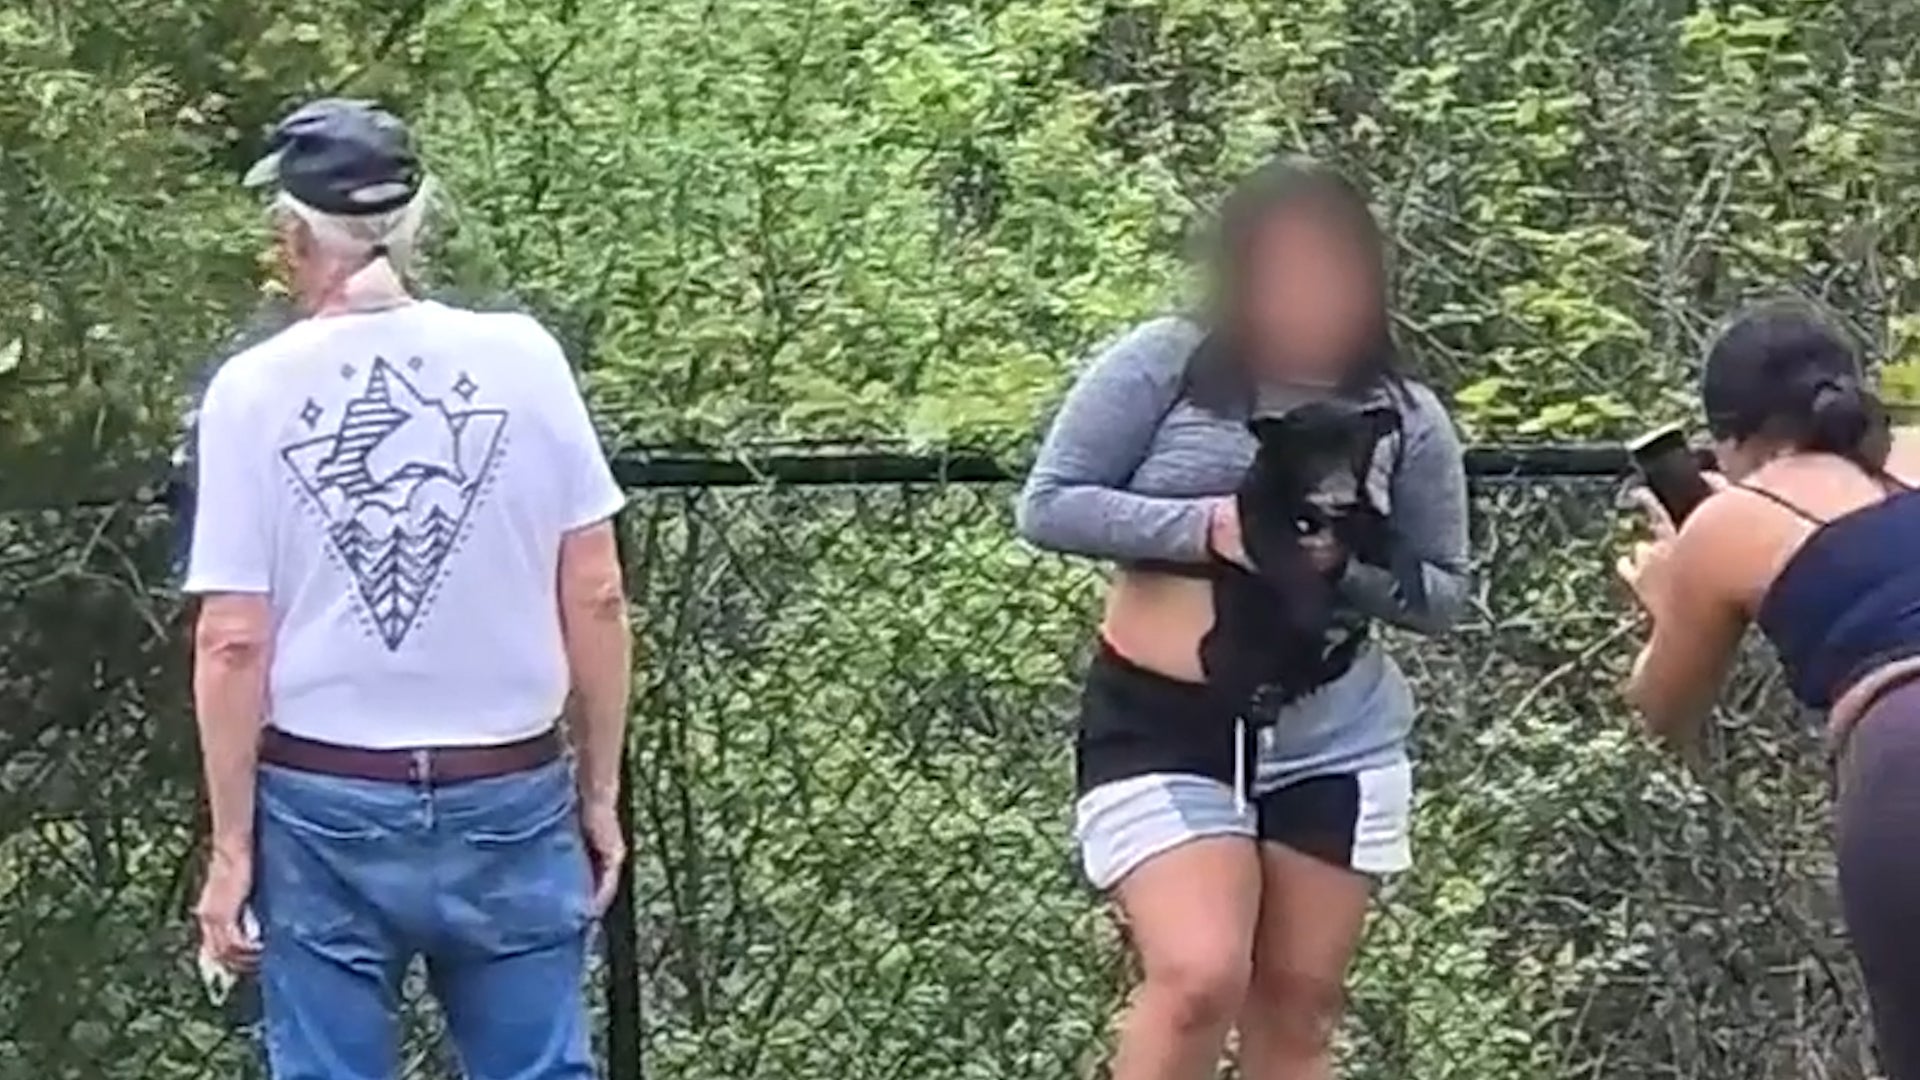
Group Yanks Bear Cubs From Tree To Take Selfies
Shocking video shows a group of people pulling black bear cubs out of a tree and then posing for selfies. Watch this video to find out why those people won’t be facing any charges.