Skip to Main Content
_
Sensor Network
Maps & Radar
Severe Weather
News & Blogs
Mobile Apps
More
Search
close
gps_fixed
gps_fixed
Find Nearest Station
Manage Favorite Cities
Log In
Go Ad Free
account_box
Log in
Go Ad Free
settings
Settings
Sensor Network
Maps & Radar
Severe Weather
News & Blogs
Mobile Apps
Historical Weather
star
Current Weather for
Popular
Cities
San Francisco, CA
51
°
F
Fair
Manhattan, NY
55
°
F
Sunny
Schiller Park, IL (60176)
warning
52
°
F
Clear
Boston, MA
51
°
F
Sunny
Houston, TX
73
°
F
Cloudy
St James's, England, United Kingdom
52
°
F
Cloudy
Search
close
gps_fixed
gps_fixed
Find Nearest Station
Manage Favorite Cities
settings
--
Feels like
--
--
--
/
--
--
--
--
--
--
--
--
--
--
12AM
6AM
NOON
6PM
12AM
Apr 16
+0000
Apr 17
Full Forecast
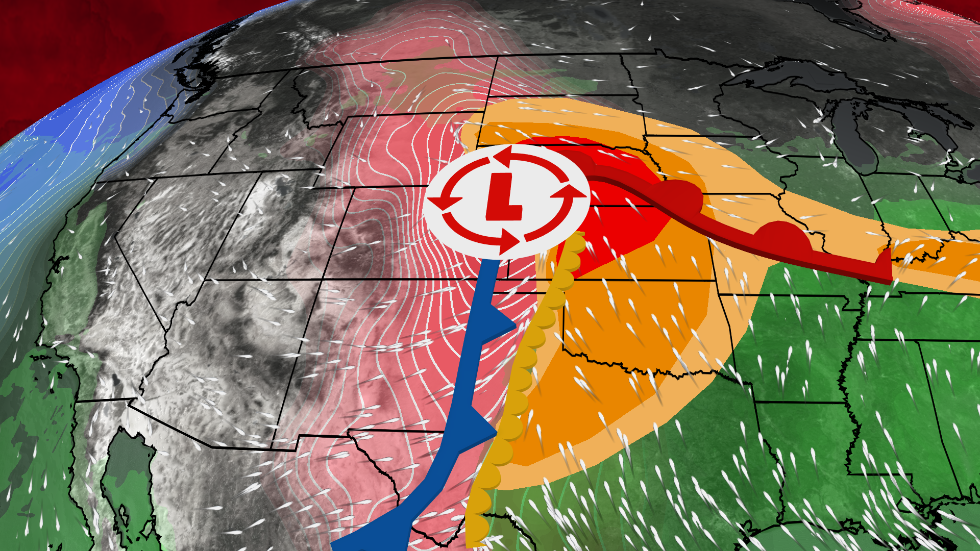
Dangerous Severe Weather Setup Shaping Up
We've had a lot of severe weather lately. Here's what we are most concerned about in the coming days.
Dangerous Severe Weather Setup Shaping Up
What Makes Supercells The King Of All Thunderstorms
Here is all you'd like to know about why supercells are so long-lived and dangerous.
What Makes Supercells The King Of All Thunderstorms
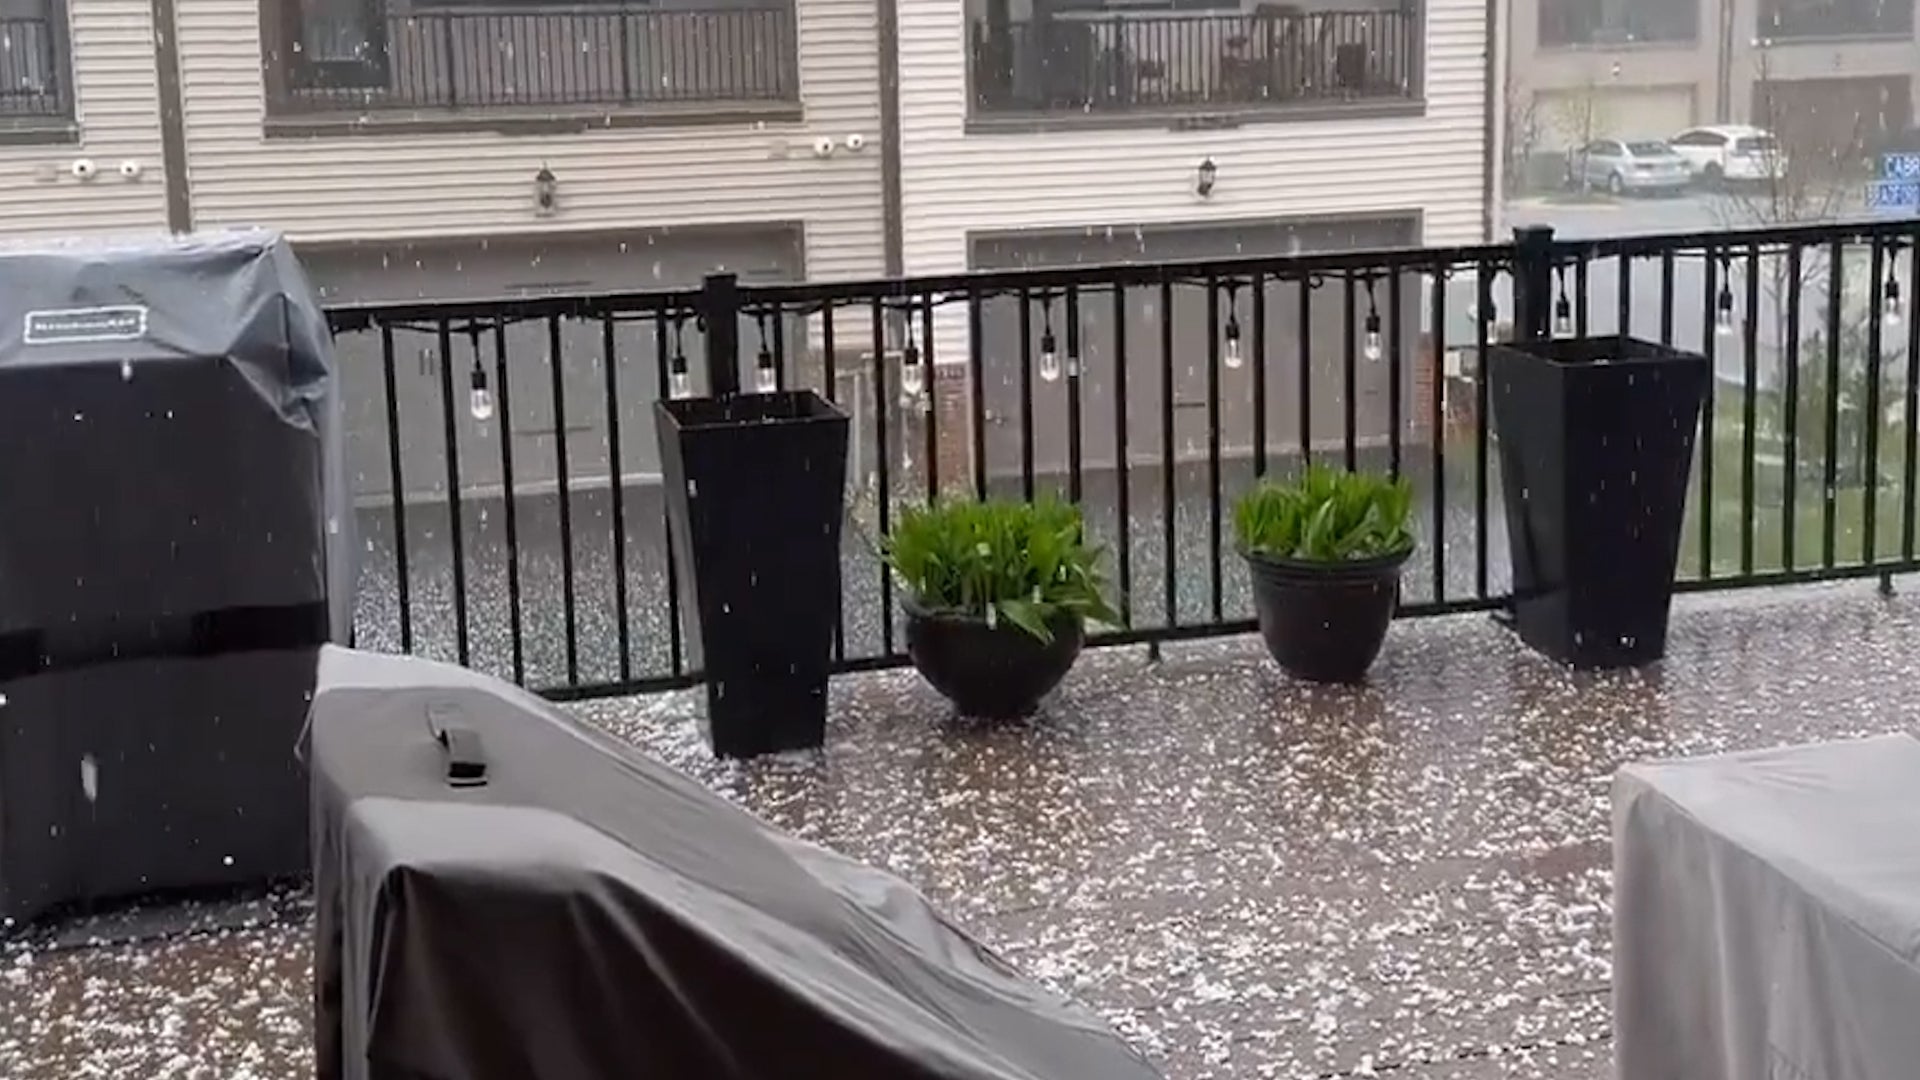
Hailstorms Pound Washington Suburbs
Severe thunderstorms including hailstorms made for a messy Monday in the Washington, D.C., area.
Hailstorms Pound Washington Suburbs
They're Coming: Trillions To Emerge
Trillions of cicadas will emerge in May in the Midwest and Southeast, in a double-brood event that hasn’t happened in more than 200 years.
They're Coming: Trillions To Emerge
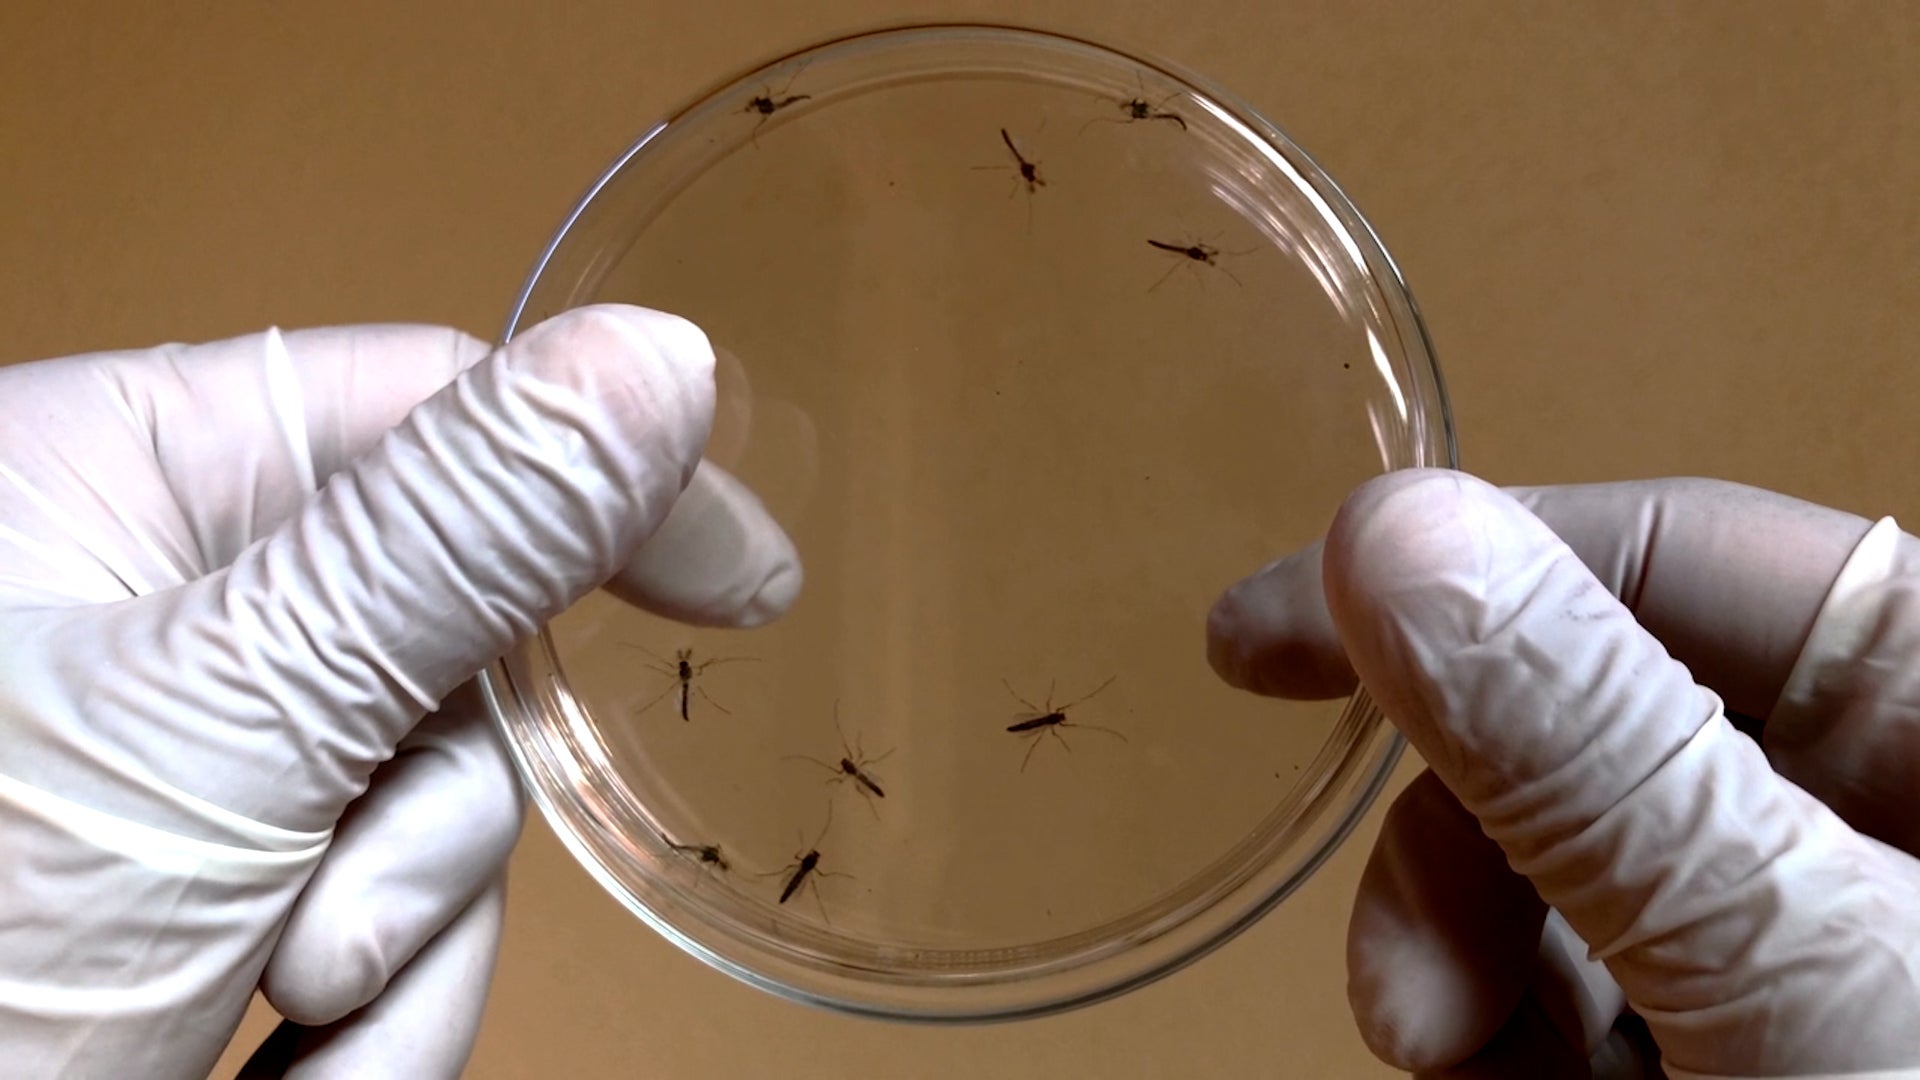
Virus Surging In Summer Travel Hotspots
More than 4 million cases of the mosquito-borne virus, dengue, have been reported worldwide this year, and that number is only expected to get higher. See how you can protect yourself before jetting off for vacation this summer.
Virus Surging In Summer Travel Hotspots
Please enable JavaScript to continue using this application.