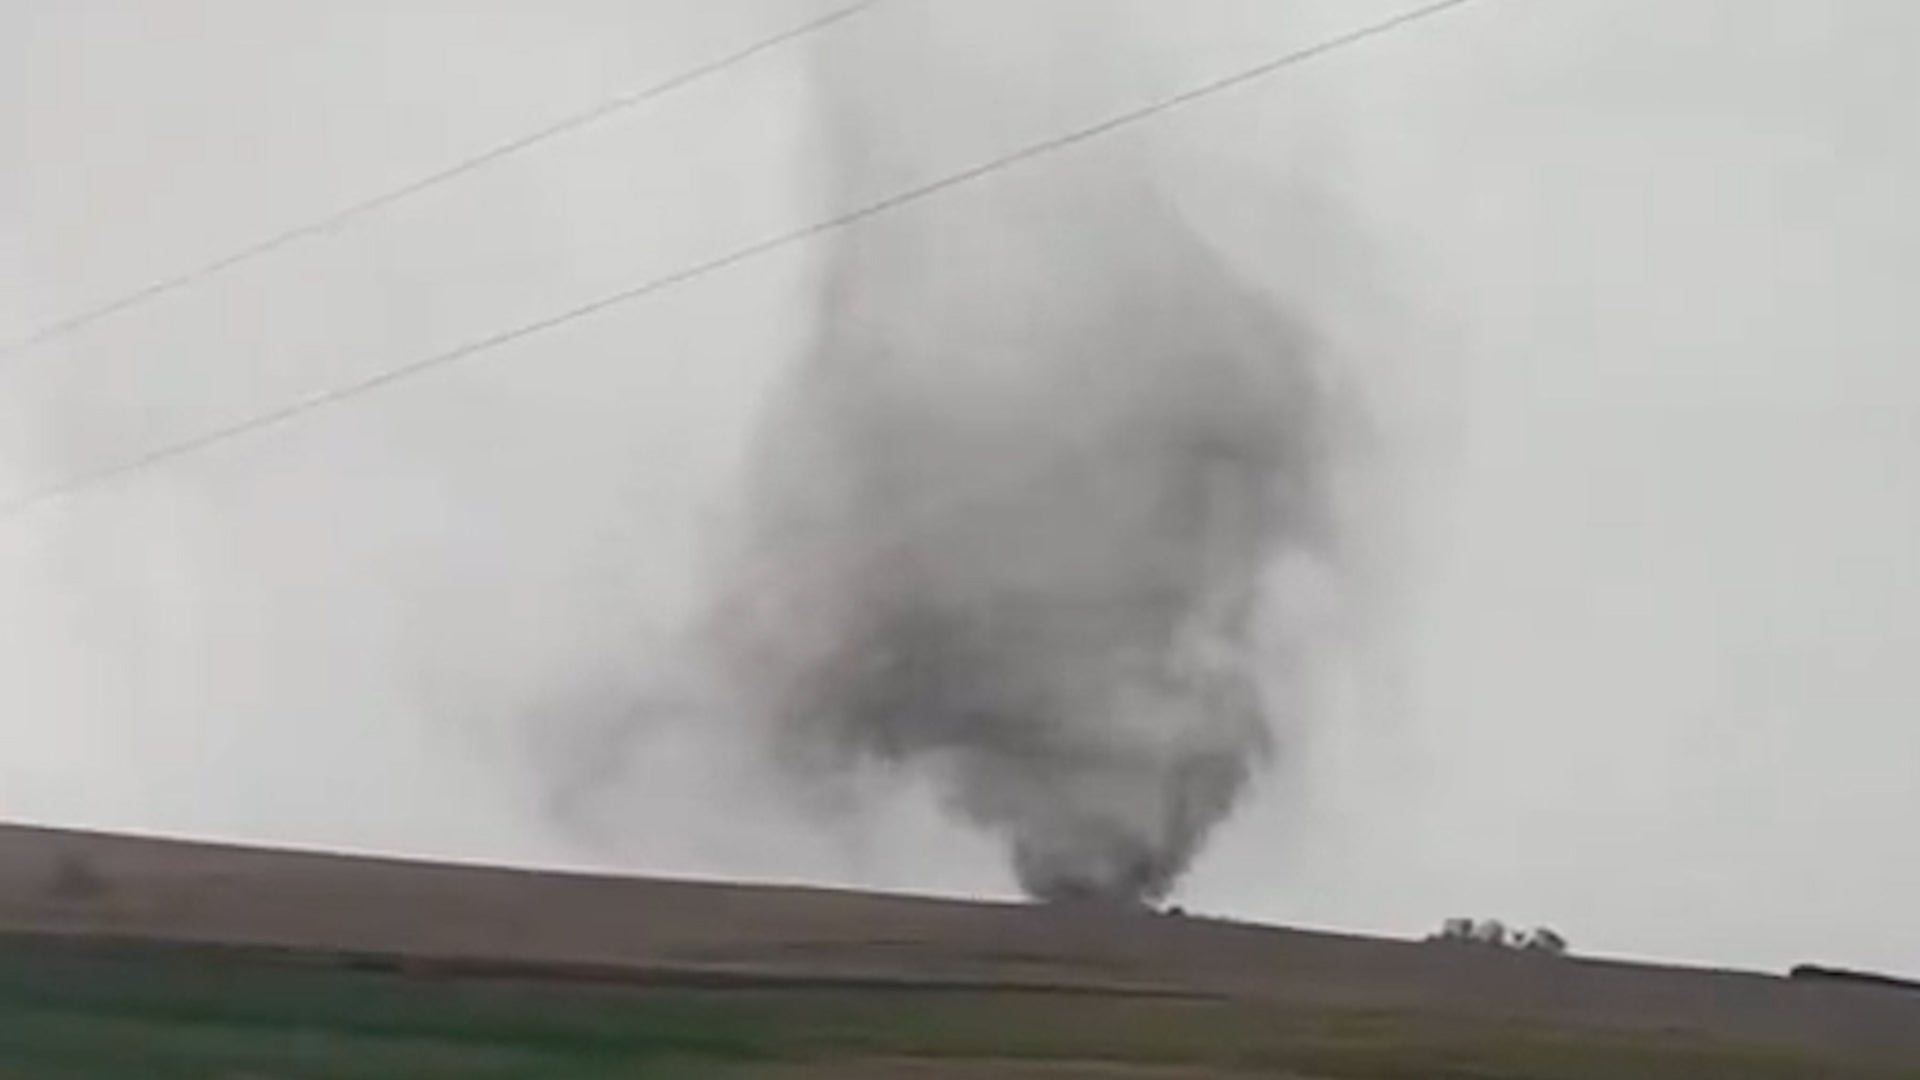
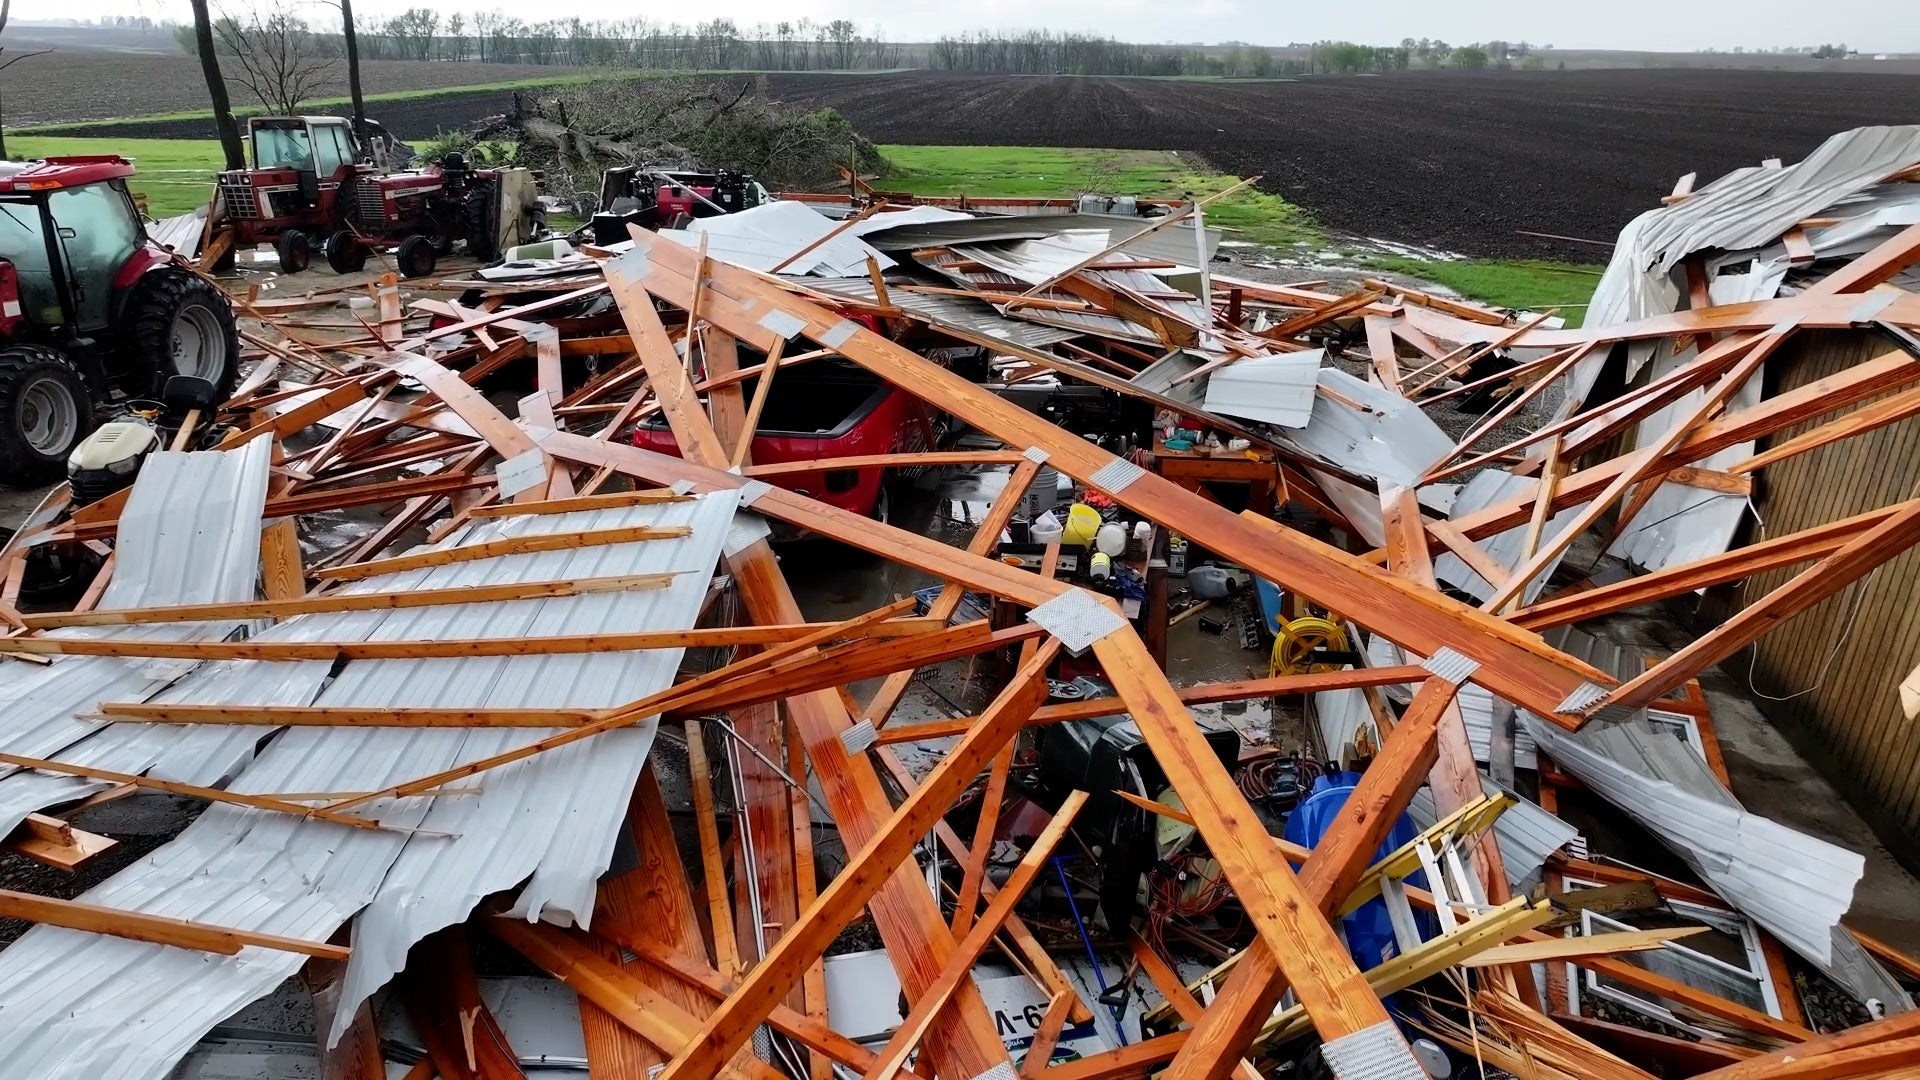
At least one tornado has been confirmed from storms that devastated parts of Southeast Iowa on Tuesday. See how the twister ripped apart homes and farmsteads, burying trucks and heavy equipment under debris.
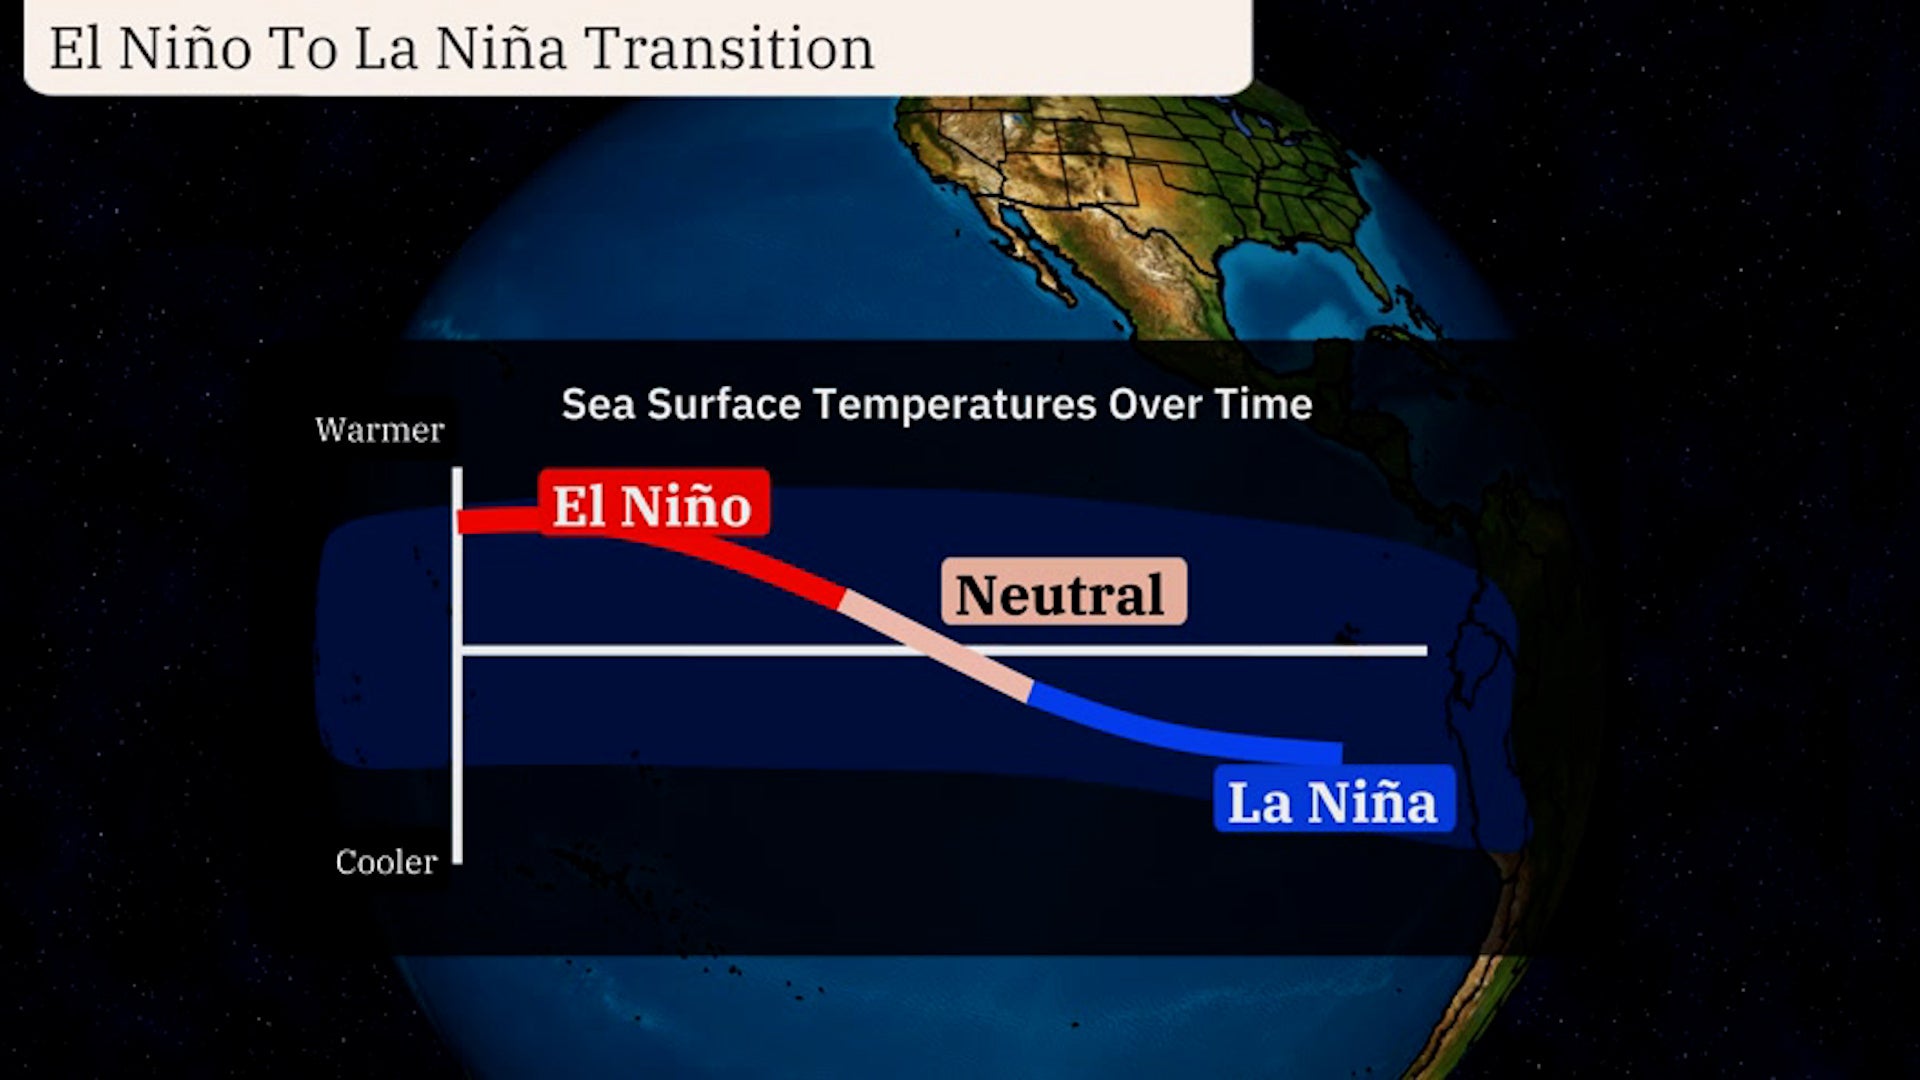
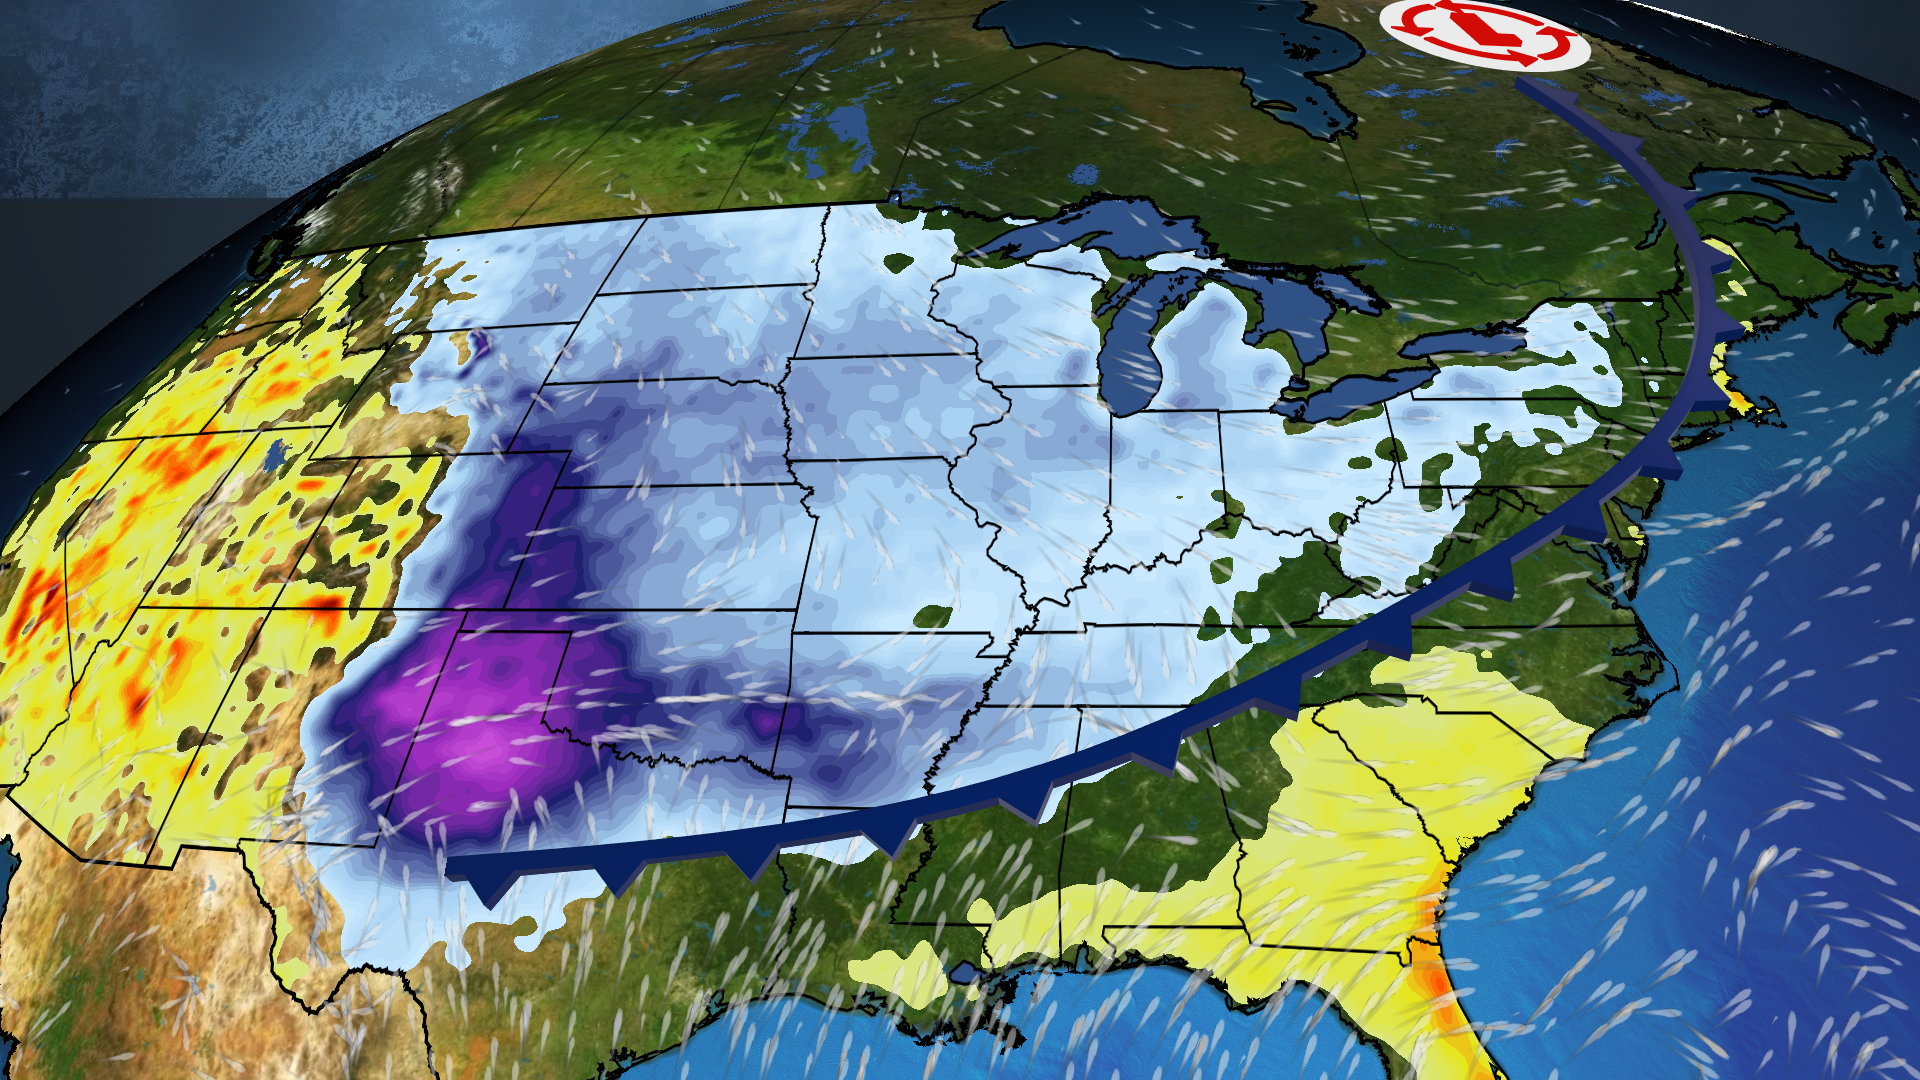
The natural phenomenon known as El Niño is weakening but there’s some disagreement among scientists about what’s coming next. Watch this video to see why it matters to you.