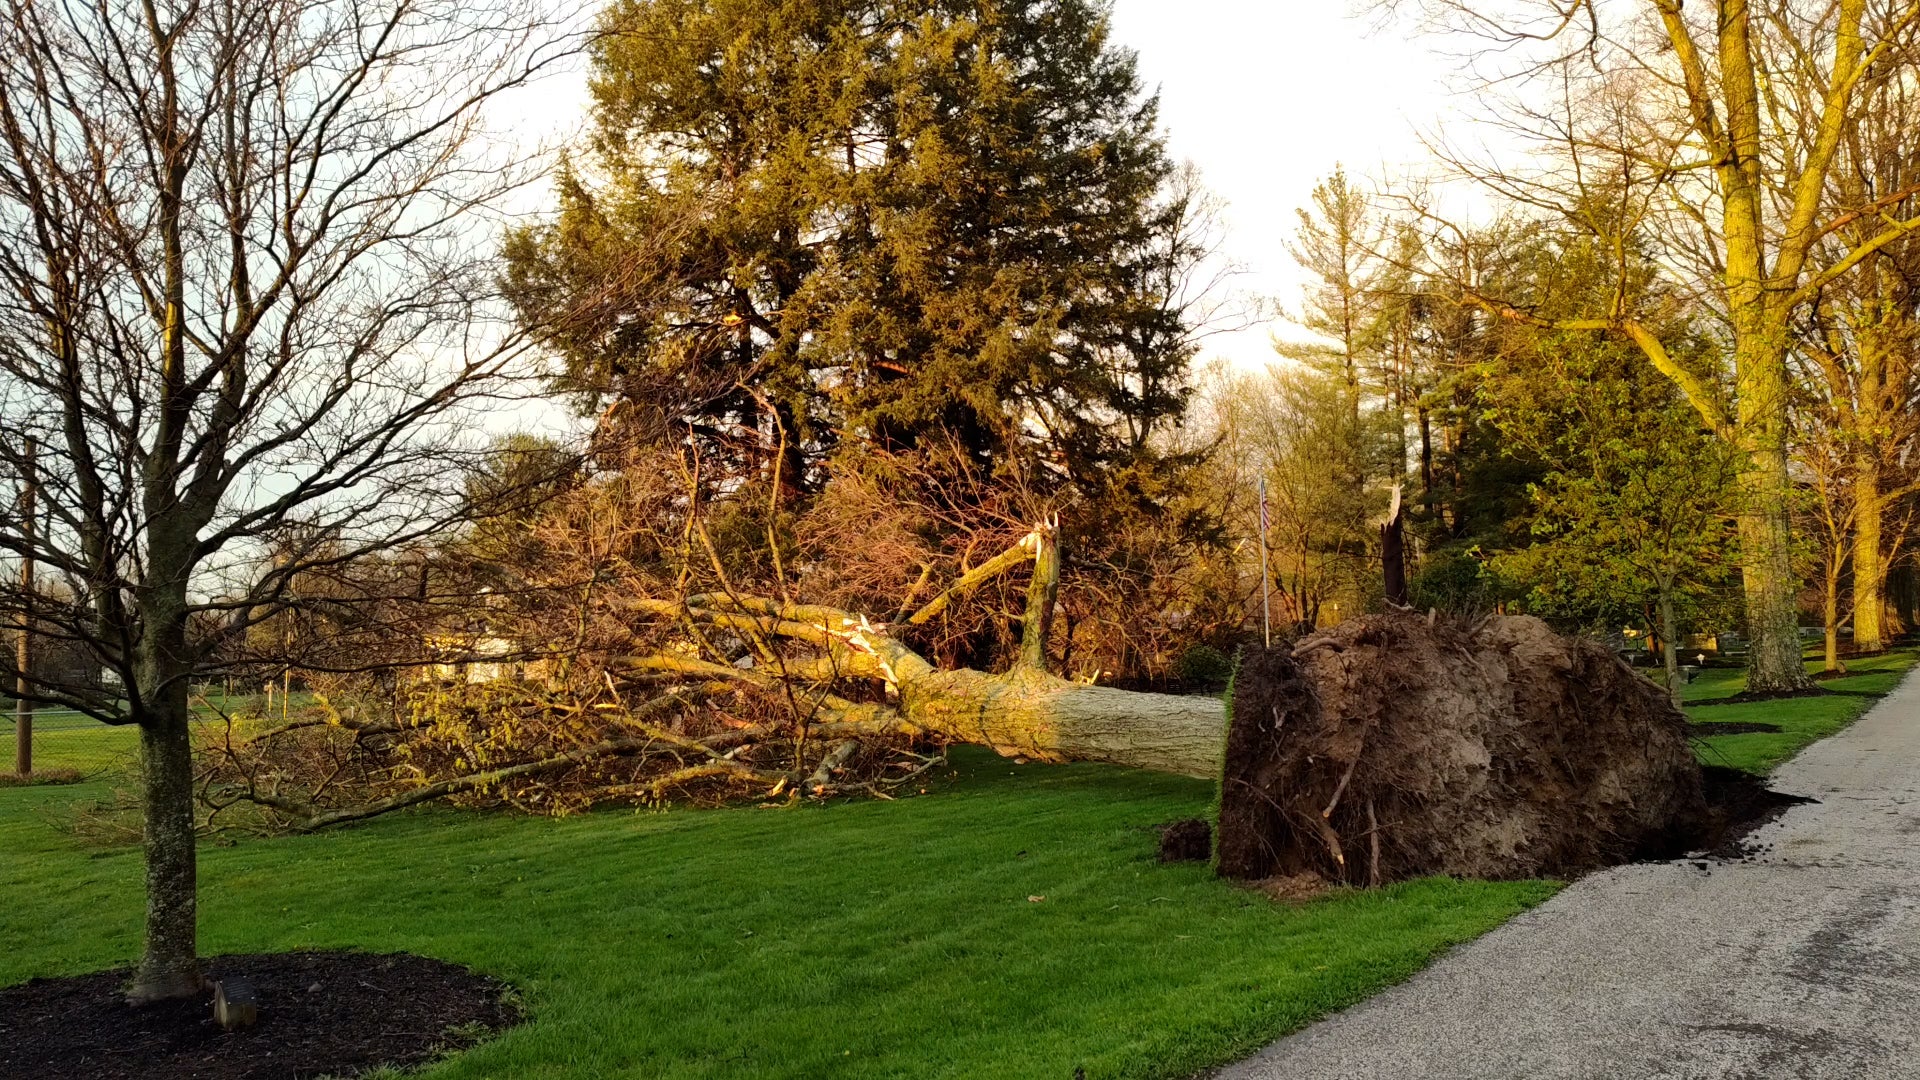
A round of severe thunderstorms crossing the Midwest left behind serious damage in some places. Homes and outbuildings were crushed or ripped apart by powerful winds, possibly from tornadoes. Take a look at the damage.
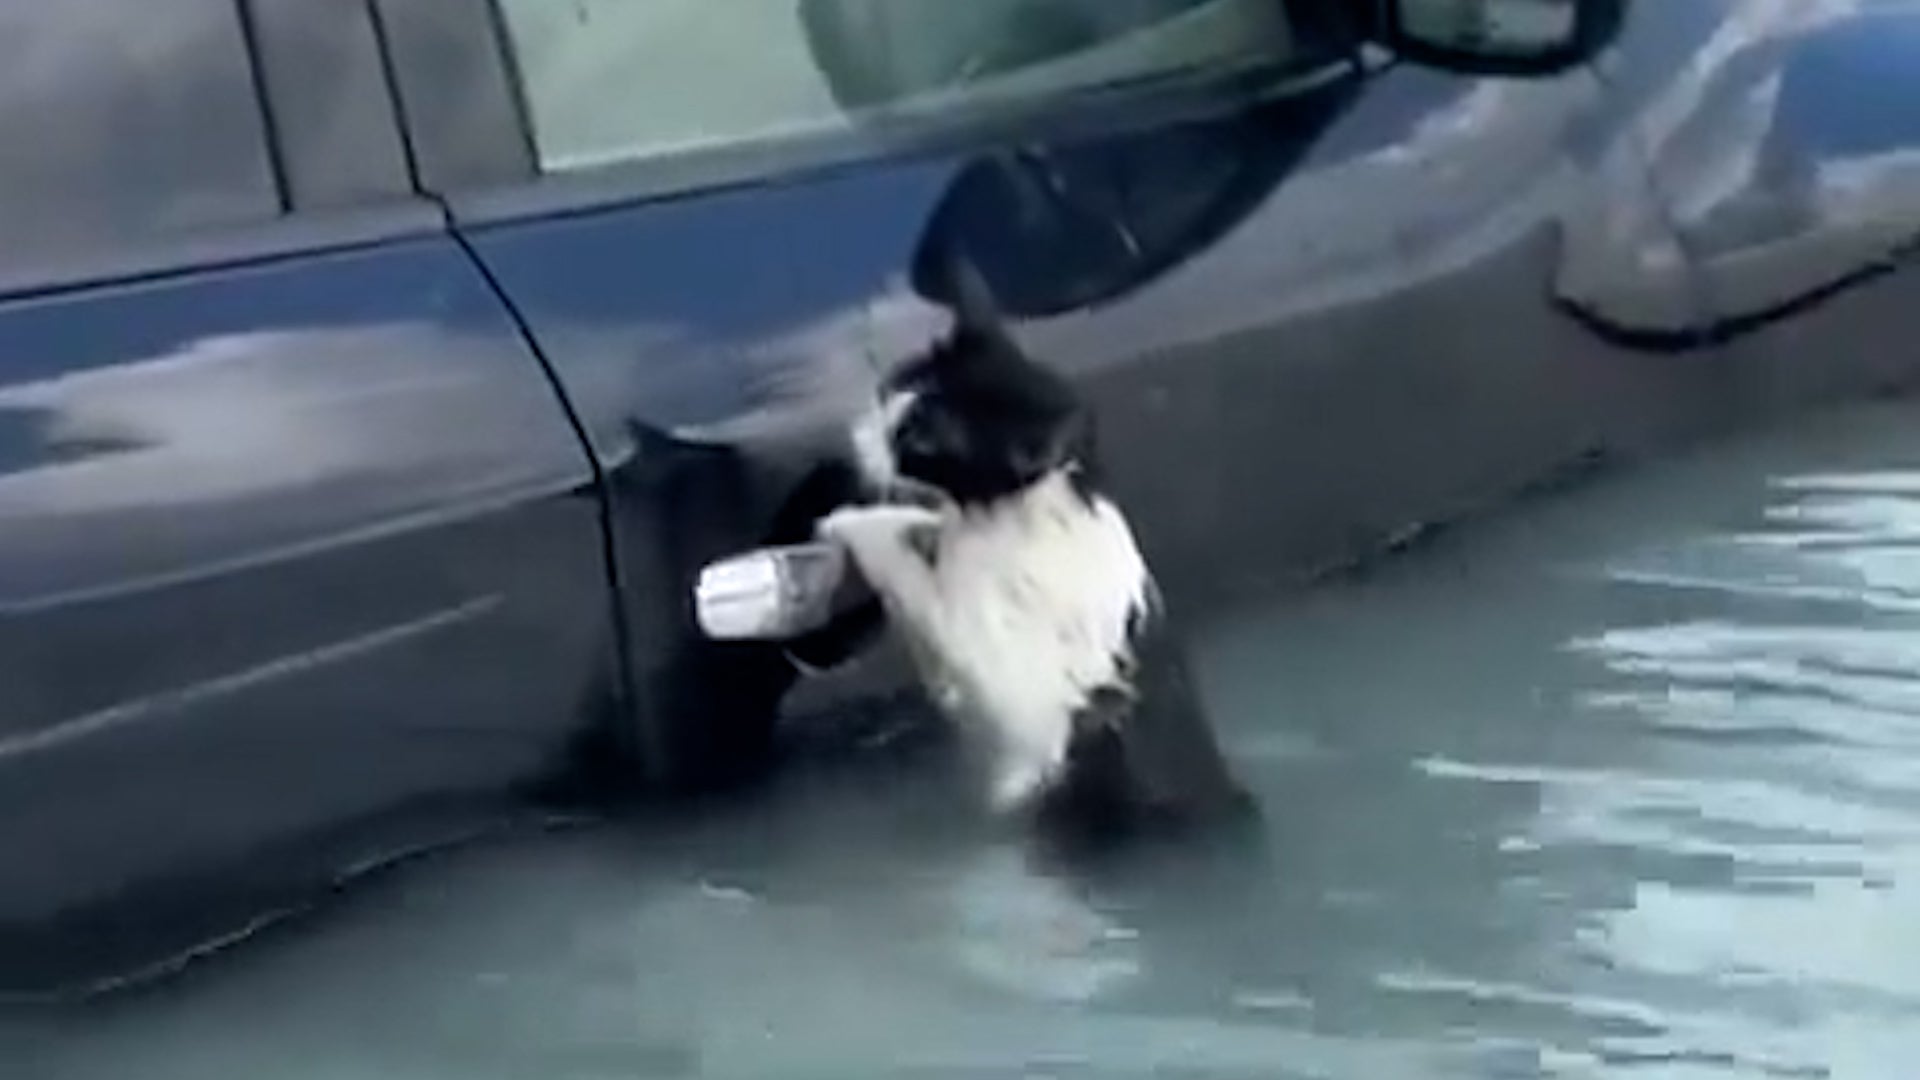
The city of Dubai was hit with a year’s worth of rain in just 24 hours, and one little cat got caught in the flooding that had people abandoning their cars in the middle of the street. Watch this video to see how the little kitty was rescued.