Skip to Main Content
_
Sensor Network
Maps & Radar
Severe Weather
News & Blogs
Mobile Apps
More
Search
close
gps_fixed
gps_fixed
Find Nearest Station
Manage Favorite Cities
Log In
Go Ad Free
account_box
Log in
Go Ad Free
settings
Settings
Sensor Network
Maps & Radar
Severe Weather
News & Blogs
Mobile Apps
Historical Weather
star
Current Weather for
Popular
Cities
San Francisco, CA
51
°
F
Partly Cloudy
Manhattan, NY
52
°
F
Cloudy
Schiller Park, IL (60176)
40
°
F
Fair
Boston, MA
50
°
F
Rain
Houston, TX
77
°
F
Mostly Cloudy
St James's, England, United Kingdom
51
°
F
Mostly Cloudy
Search
close
gps_fixed
gps_fixed
Find Nearest Station
Manage Favorite Cities
settings
--
Feels like
--
--
--
/
--
--
--
--
--
--
--
--
--
--
12AM
6AM
NOON
6PM
12AM
Apr 20
+0000
Apr 21
Full Forecast
How To See The Massive Once-In-A-Lifetime Comet This Weekend
The bright green comet 12P/Pons-Brooks, also known as the “devil” and “mother of dragons,” will reach peak visibility soon. Here’s how to spot it.
How To See The Massive Once-In-A-Lifetime Comet This Weekend
Wet, Stormy Weekend For These Areas
Severe storms are possible this weekend in the South, from Texas to the Atlantic Coast.
Wet, Stormy Weekend For These Areas
Growing Fear Of Bird Flu Spreading To Humans
The World Health Organization says the potential spread of bird flu to humans is of “enormous concern,” citing the disease’s recent jump to dairy cows.
Growing Fear Of Bird Flu Spreading To Humans
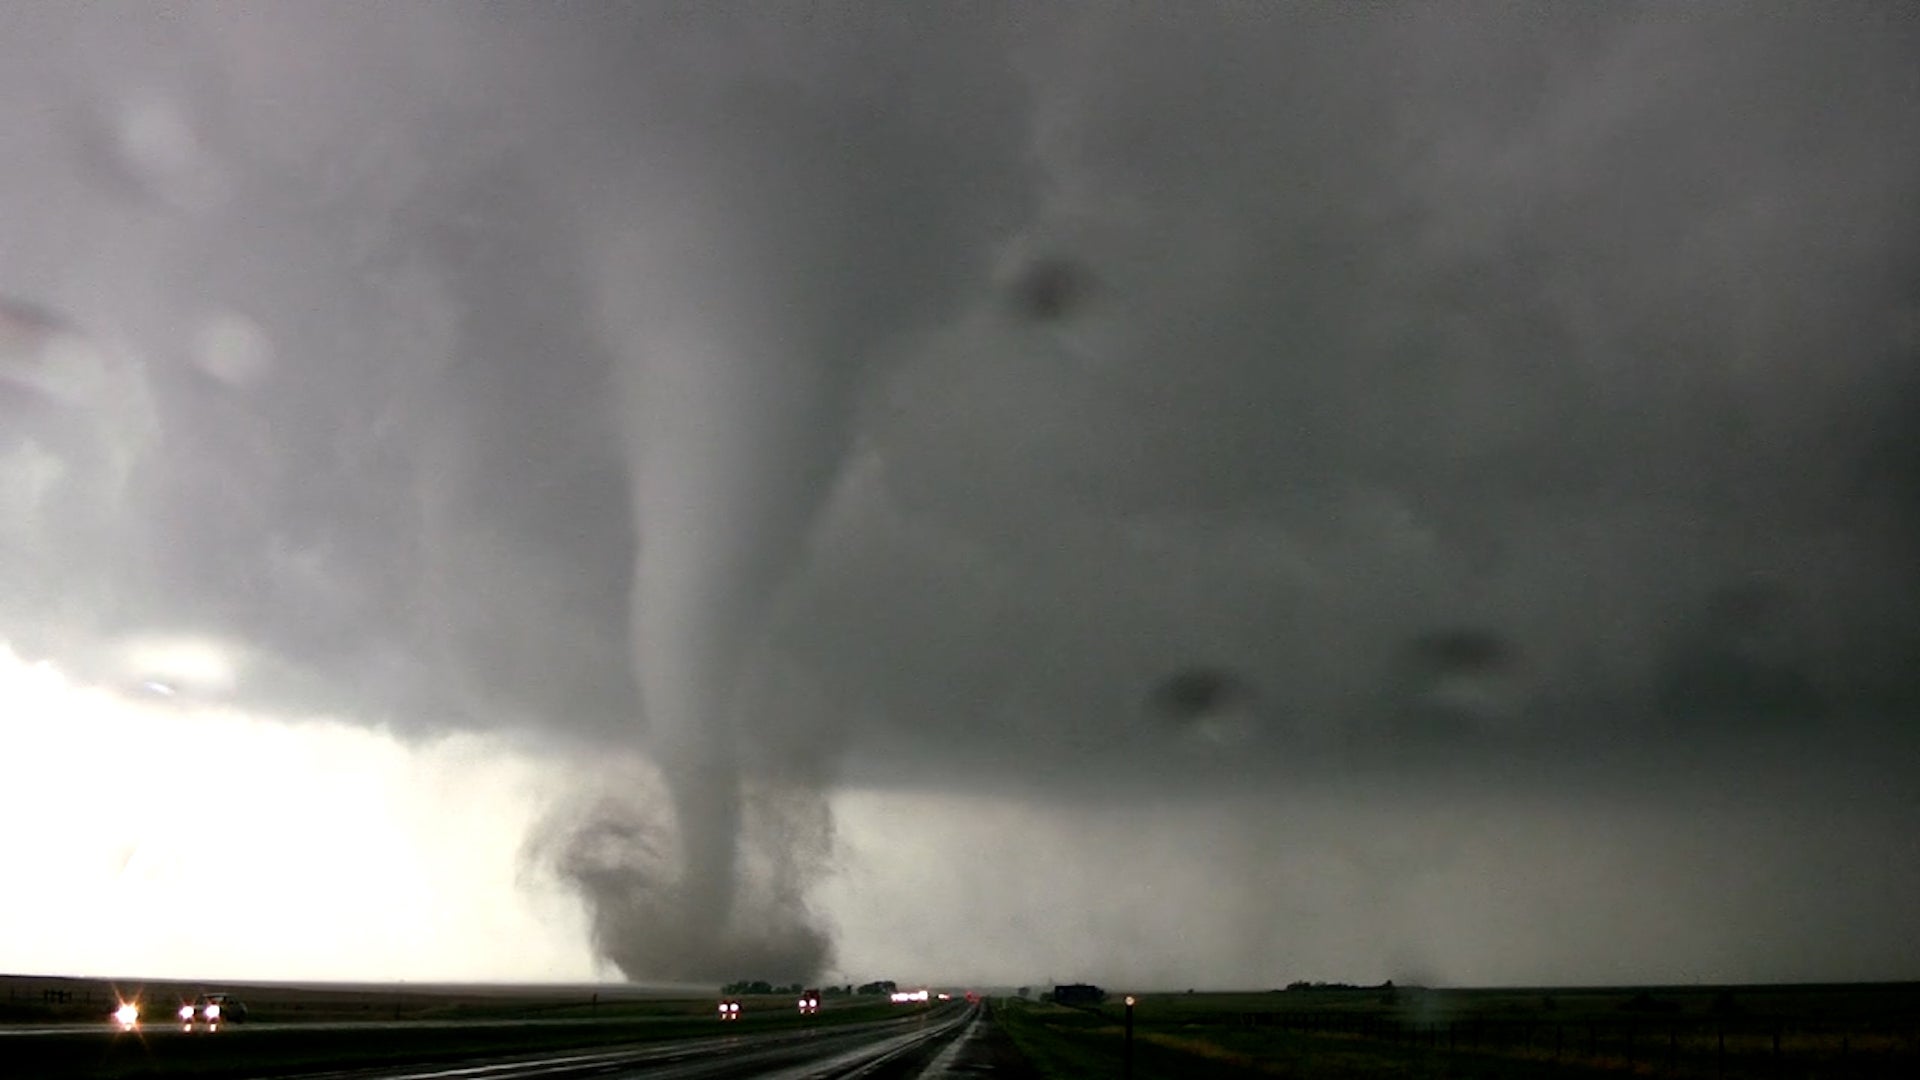
What To Do When You See a Tornado While Driving
A tornado is serious business, and it’s easy to panic if you see one while driving. Here’s how you can be prepared for the situation ahead of time.
What To Do When You See a Tornado While Driving
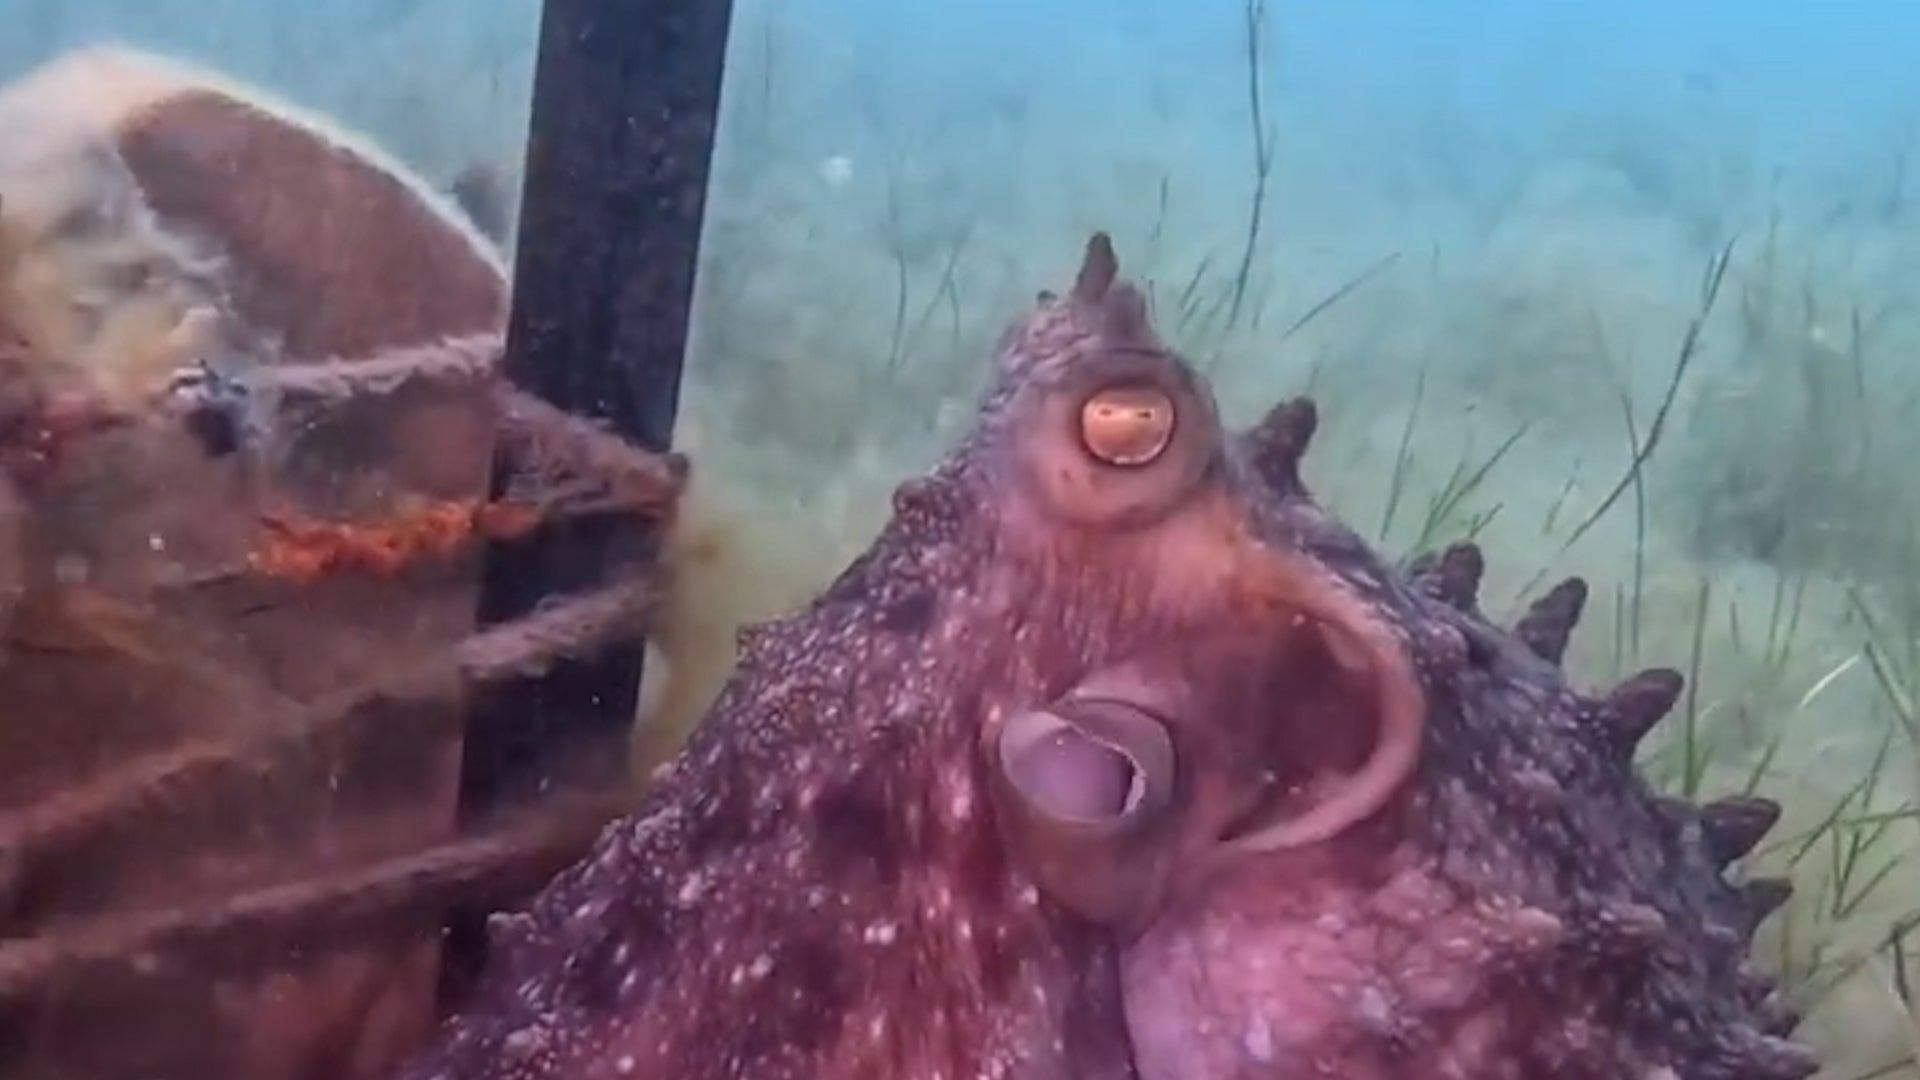
Massive Octopus Leads Diver To Underwater Mystery
An Australian diver was “shocked” when a friendly octopus led her by the hand to show her an underwater mystery.
Massive Octopus Leads Diver To Underwater Mystery
Please enable JavaScript to continue using this application.