Skip to Main Content
_
Sensor Network
Maps & Radar
Severe Weather
News & Blogs
Mobile Apps
More
Search
close
gps_fixed
gps_fixed
Find Nearest Station
Manage Favorite Cities
Log In
Go Ad Free
account_box
Log in
Go Ad Free
settings
Settings
Sensor Network
Maps & Radar
Severe Weather
News & Blogs
Mobile Apps
Historical Weather
star
Current Weather for
Popular
Cities
San Francisco, CA
56
°
F
Cloudy
Manhattan, NY
52
°
F
Mostly Cloudy
Schiller Park, IL (60176)
warning
39
°
F
Cloudy
Boston, MA
50
°
F
Cloudy
Houston, TX
71
°
F
Cloudy
St James's, England, United Kingdom
48
°
F
Cloudy
Search
close
gps_fixed
gps_fixed
Find Nearest Station
Manage Favorite Cities
settings
--
Feels like
--
--
--
/
--
--
--
--
--
--
--
--
--
--
12AM
6AM
NOON
6PM
12AM
Apr 24
+0000
Apr 25
Full Forecast
Hurricane Season Doesn't Have To Wait Until June
It sounds weird, but it could happen again in 2024. Here's why.
Hurricane Season Doesn't Have To Wait Until June
Multi-Day Severe Threat Includes Tornadoes
A classic springtime setup will ignite bouts of severe storms in the central U.S. beginning Thursday. Here's what to know.
Multi-Day Severe Threat Includes Tornadoes
These Are The Signs A Severe Outbreak Is On The Way
Severe weather outbreaks increase in frequency this time of the year as a meticulous set of ingredients come together over the nature’s heartland.
These Are The Signs A Severe Outbreak Is On The Way
Scaly Stowaway: 10-Foot Gator Creeps Onto Air Force Base
Imagine being a pilot and seeing this hiding under your plane…
Scaly Stowaway: 10-Foot Gator Creeps Onto Air Force Base
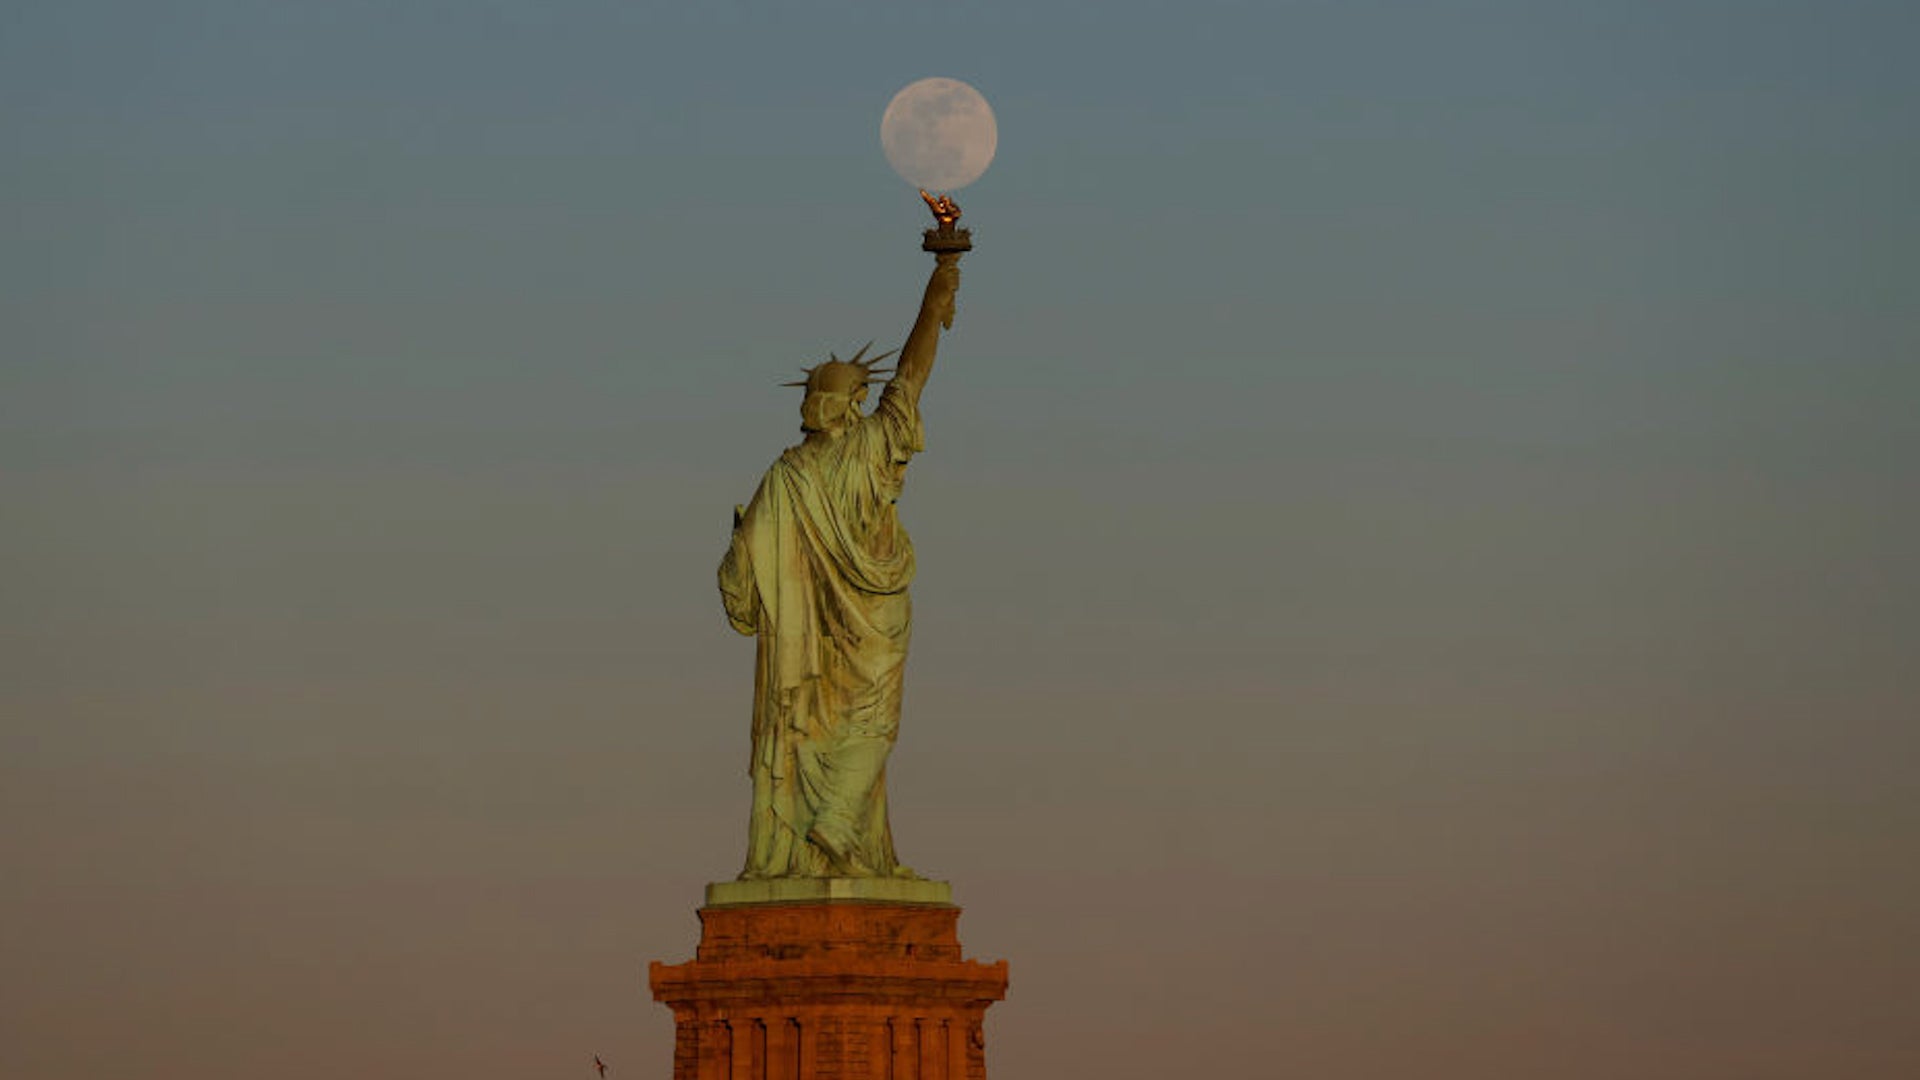
Landmarks Take A Back Seat To Stunning ‘Pink Moon’
April’s full moon put on a spectacular show, outshining some of the most famous places in the world. Watch this video to see why it’s called a “pink moon” and how much longer it will last.
Landmarks Take A Back Seat To Stunning ‘Pink Moon’
Please enable JavaScript to continue using this application.