Nearly every hotel in Acapulco was either destroyed or damaged by Hurricane Otis last year. Now, the struggling resort city is facing a different sort of natural peril: raging wildfires.
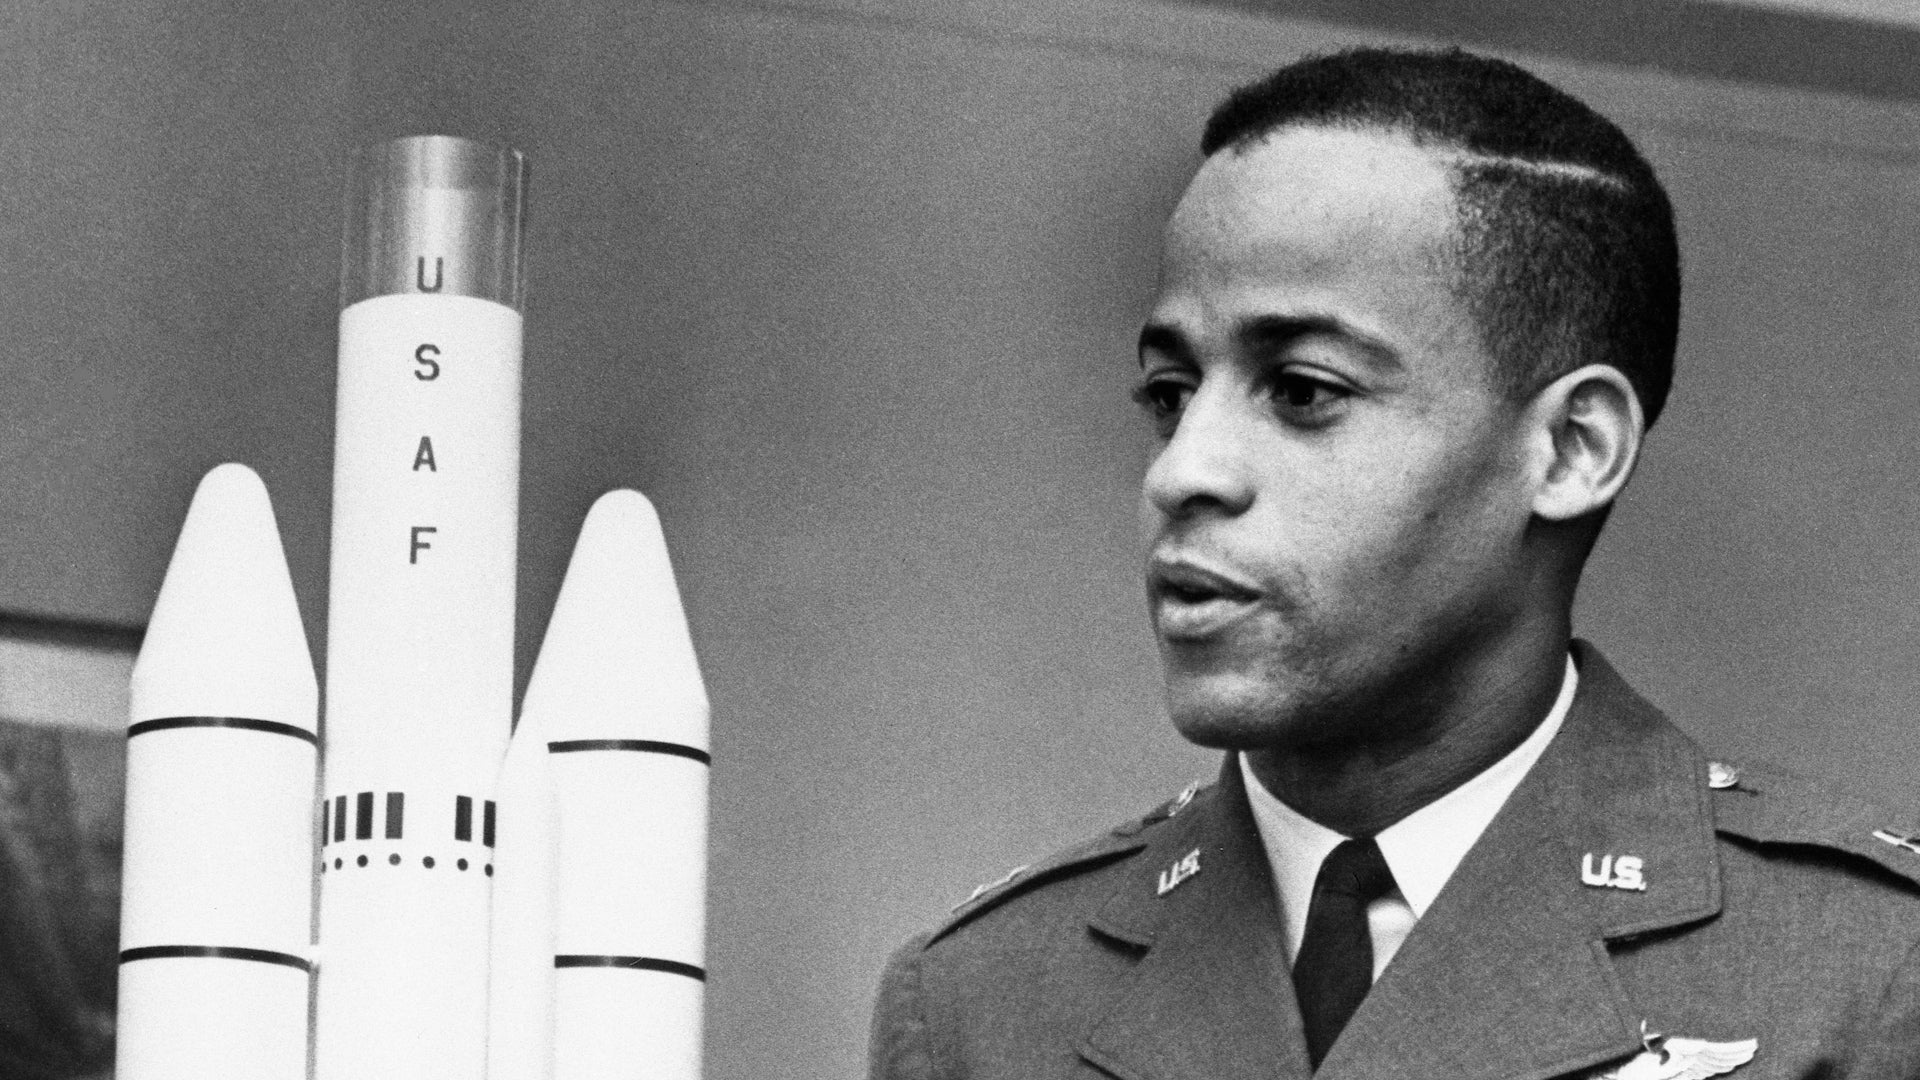
Decades after being poised to become America’s first Black astronaut, Ed Dwight will finally gaze upon Earth from space aboard Blue Origin’s NS-25 mission at the age of 90.