Skip to Main Content
_
Sensor Network
Maps & Radar
Severe Weather
News & Blogs
Mobile Apps
More
Search
close
gps_fixed
gps_fixed
Find Nearest Station
Manage Favorite Cities
Log In
Go Ad Free
account_box
Log in
Go Ad Free
settings
Settings
Sensor Network
Maps & Radar
Severe Weather
News & Blogs
Mobile Apps
Historical Weather
star
Current Weather for
Popular
Cities
San Francisco, CA
warning
72
°
F
Sunny
Manhattan, NY
warning
82
°
F
Partly Cloudy
Schiller Park, IL (60176)
78
°
F
Fair
Boston, MA
58
°
F
Cloudy
Houston, TX
warning
87
°
F
Mostly Cloudy
St James's, England, United Kingdom
65
°
F
Sunny
Search
close
gps_fixed
gps_fixed
Find Nearest Station
Manage Favorite Cities
settings
warning
Active Advisory
:
Small Craft Advisory
(
See More
)
--
Feels like
--
--
--
/
--
--
--
--
--
--
--
--
--
--
12AM
6AM
NOON
6PM
12AM
May 8
+0000
May 9
Full Forecast
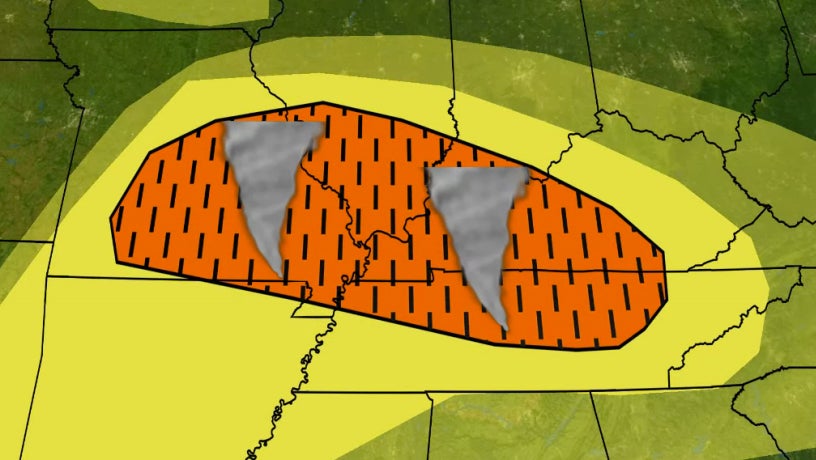
Severe Weather Expected To Bring Tornadoes, Wind, Hail, And Flooding
Another severe thunderstorm outbreak is spreading through the Midwest, South and East. Here's a look at the forecast.
Severe Weather Expected To Bring Tornadoes, Wind, Hail, And Flooding
Today's Tornado Threat: 5 Things You Need To Know
Tornadoes are a concern in the Midwest and South through Wednesday night. Here's what to know about this threat.
Today's Tornado Threat: 5 Things You Need To Know
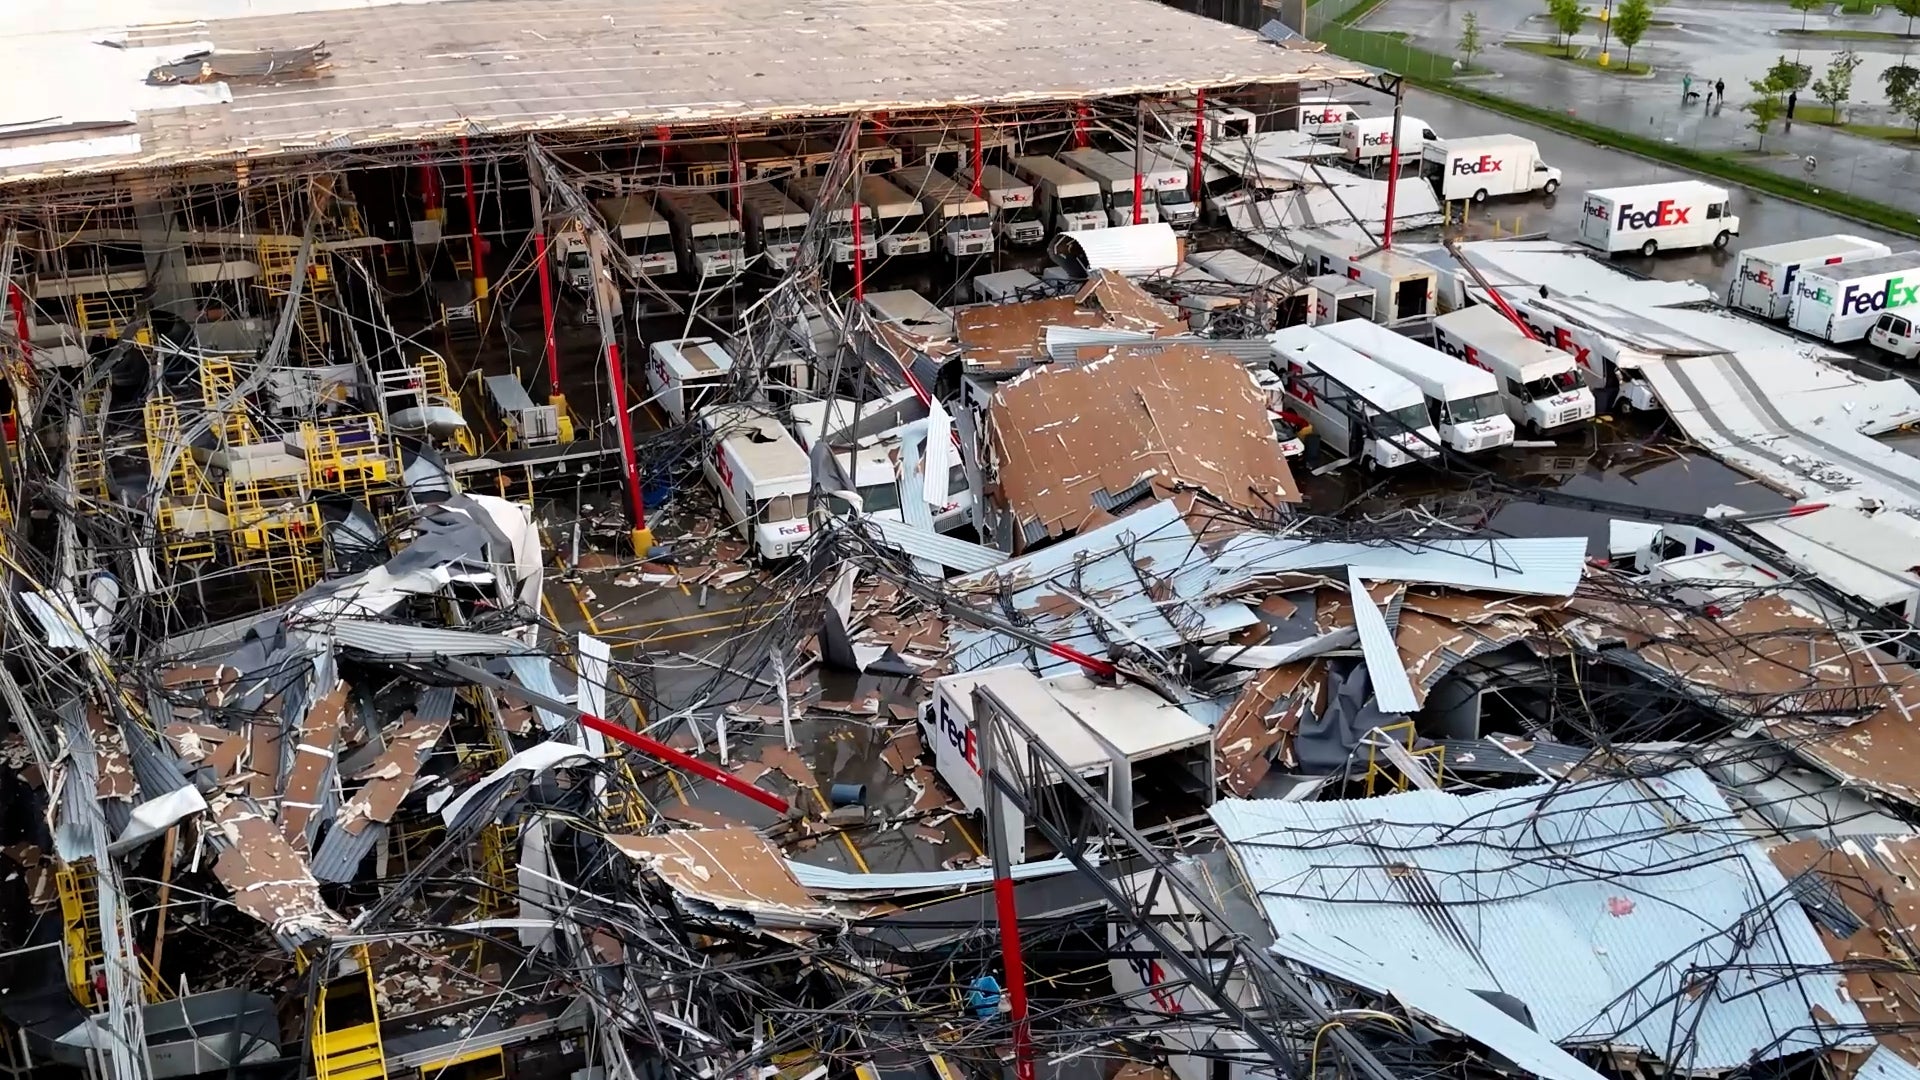
Tornadoes Pummeled Michigan; Flattening FedEx Facility
Several tornadoes hit southern Michigan on Tuesday night, striking a FedEx facility in Portage. Here's the latest.
Tornadoes Pummeled Michigan; Flattening FedEx Facility
Shocking Video Captures Tornado Shrapnel Impaling Hotel Wall
A tornado in Bartlesville, Oklahoma, inflicted significant damage on a Hampton Inn, turning debris into projectiles that pierced the building
Shocking Video Captures Tornado Shrapnel Impaling Hotel Wall
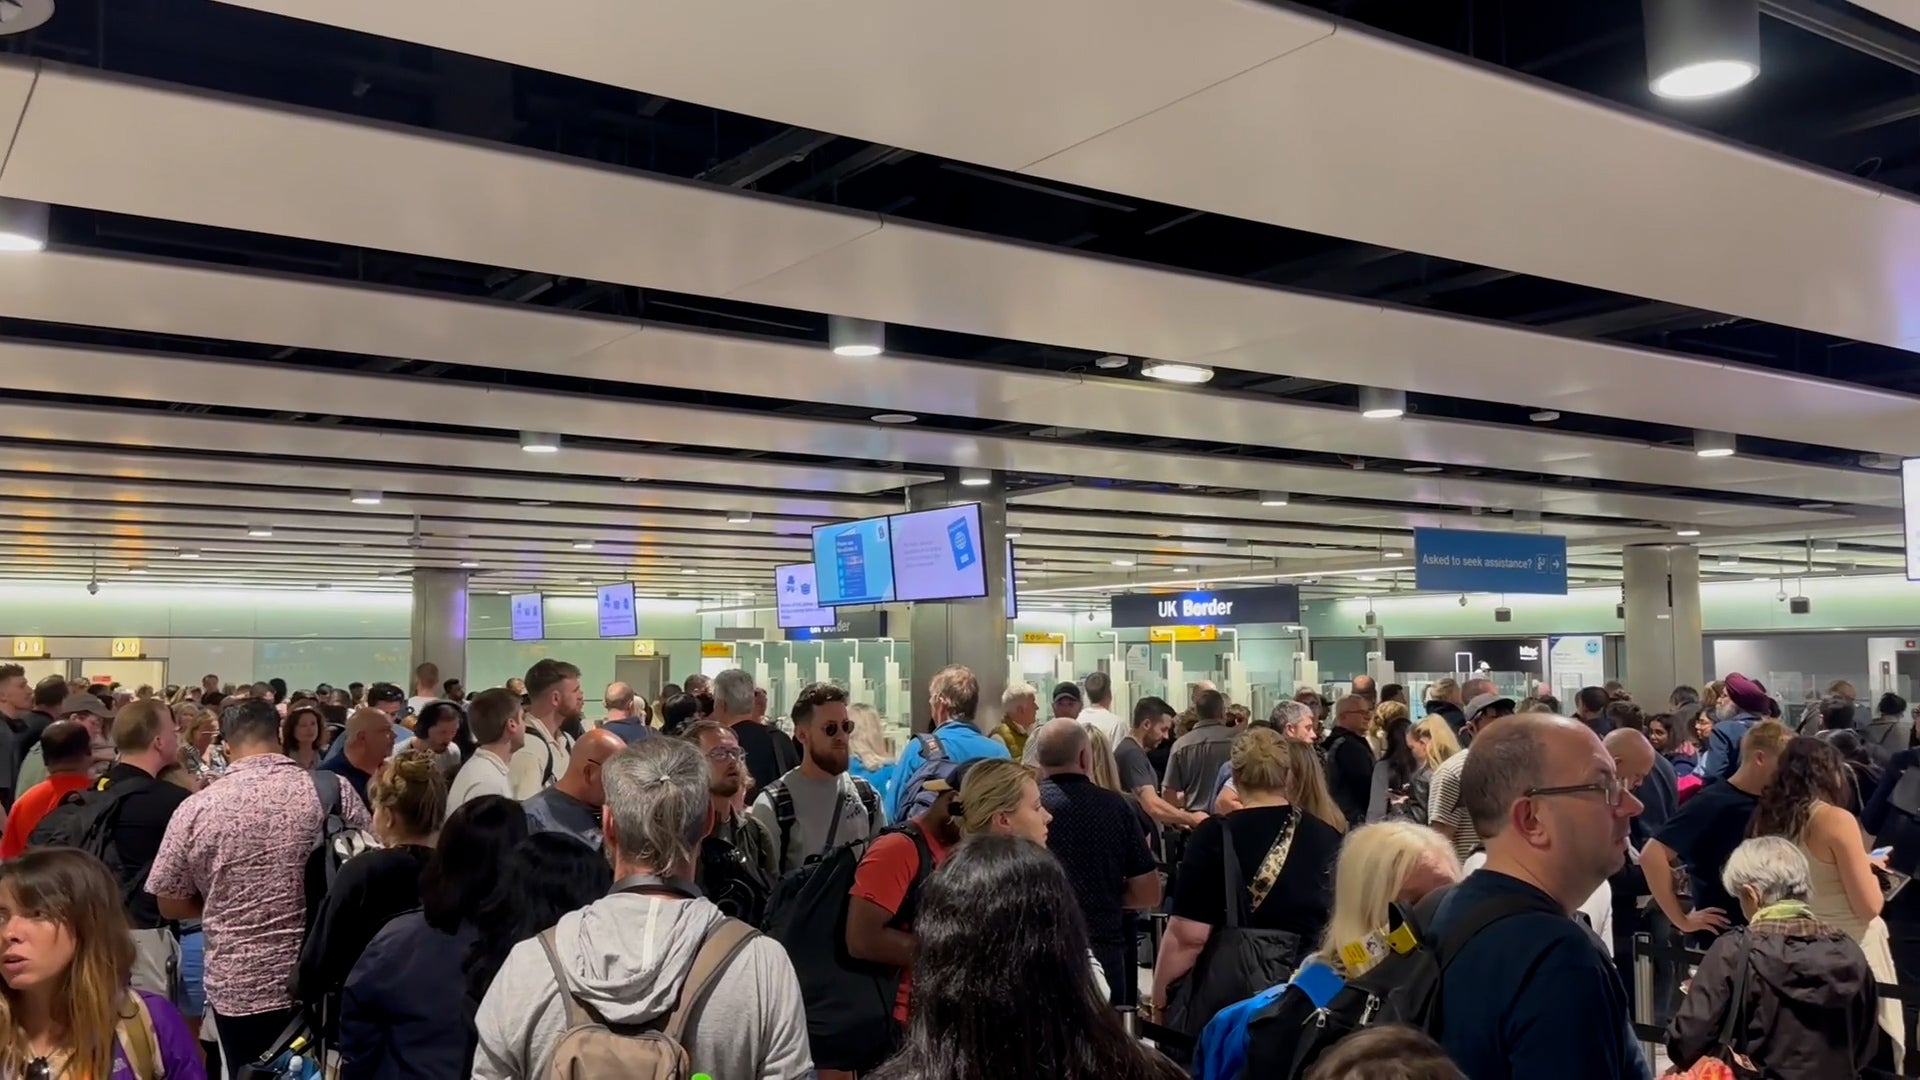
Airport Outage Leaves Thousands Of Passengers Stranded
Long lines of passengers were wrapped around terminals across the U.K. after a nationwide problem caused huge delays at some of the world’s busiest airports.
Airport Outage Leaves Thousands Of Passengers Stranded
Please enable JavaScript to continue using this application.