Skip to Main Content
_
Sensor Network
Maps & Radar
Severe Weather
News & Blogs
Mobile Apps
More
Search
close
gps_fixed
gps_fixed
Find Nearest Station
Manage Favorite Cities
Log In
Go Ad Free
account_box
Log in
Go Ad Free
settings
Settings
Sensor Network
Maps & Radar
Severe Weather
News & Blogs
Mobile Apps
Historical Weather
star
Current Weather for
Popular
Cities
San Francisco, CA
warning
54
°
F
Clear
Manhattan, NY
warning
64
°
F
Cloudy
Schiller Park, IL (60176)
53
°
F
Sunny
Boston, MA
58
°
F
Partly Cloudy
Houston, TX
warning
79
°
F
Cloudy
St James's, England, United Kingdom
63
°
F
Fair
Search
close
gps_fixed
gps_fixed
Find Nearest Station
Manage Favorite Cities
settings
warning
Active Advisory
:
Small Craft Advisory
(
See More
)
--
Feels like
--
--
--
/
--
--
--
--
--
--
--
--
--
--
12AM
6AM
NOON
6PM
12AM
May 8
+0000
May 9
Full Forecast
Dozens Trapped When Twister Smashes FedEx Facility
Several tornadoes hit southern Michigan on Tuesday night, striking a FedEx facility in Portage. Here's the latest.
Dozens Trapped When Twister Smashes FedEx Facility
Severe Weather Outbreak Brings Dangerous Storms Here Today
Another multi-day severe thunderstorm outbreak is spreading through the Midwest, South and East. Here's a look at the forecast.
Severe Weather Outbreak Brings Dangerous Storms Here Today
Shocking Video Captures Tornado Shrapnel Impaling Hotel Wall
A tornado in Bartlesville, Oklahoma, inflicted significant damage on a Hampton Inn, turning debris into projectiles that pierced the building
Shocking Video Captures Tornado Shrapnel Impaling Hotel Wall
COVID-19 Summer Surge? New Variants Raise Concerns
A new mutation of COVID-19 seems to be better at dodging your immune system, and that’s raising concerns about a potential surge of infections during the summer. Watch this video for what you need to know.
COVID-19 Summer Surge? New Variants Raise Concerns
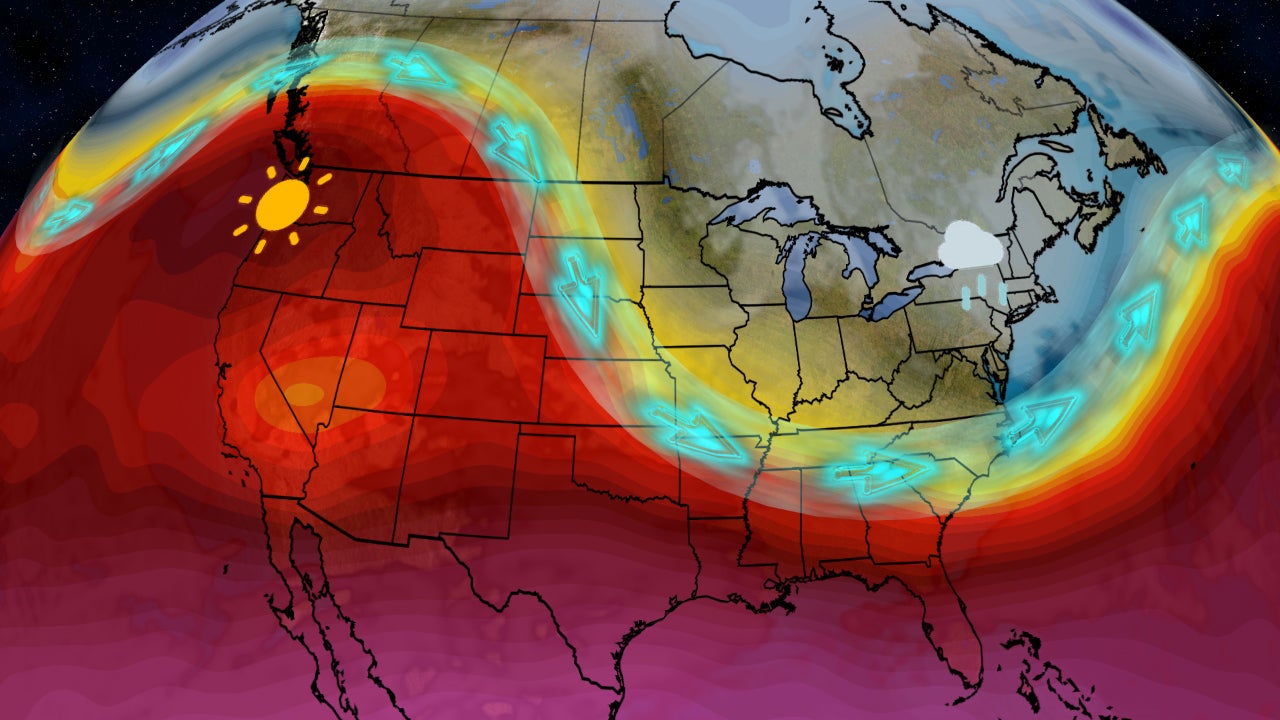
Pattern Change Ahead; What That Means For Your Forecast
Feel like your weather has been stuck in a rut? Here are the changes ahead.
Pattern Change Ahead; What That Means For Your Forecast
Please enable JavaScript to continue using this application.