Skip to Main Content
_
Sensor Network
Maps & Radar
Severe Weather
News & Blogs
Mobile Apps
More
Search
close
gps_fixed
gps_fixed
Find Nearest Station
Manage Favorite Cities
Log In
Go Ad Free
account_box
Log in
Go Ad Free
settings
Settings
Sensor Network
Maps & Radar
Severe Weather
News & Blogs
Mobile Apps
Historical Weather
star
Current Weather for
Popular
Cities
San Francisco, CA
54
°
F
Partly Cloudy
Manhattan, NY
64
°
F
Clear
Schiller Park, IL (60176)
63
°
F
Partly Cloudy
Boston, MA
64
°
F
Partly Cloudy
Houston, TX
warning
79
°
F
Cloudy
St James's, England, United Kingdom
50
°
F
Sunny
Search
close
gps_fixed
gps_fixed
Find Nearest Station
Manage Favorite Cities
settings
--
Feels like
--
--
--
/
--
--
--
--
--
--
--
--
--
--
12AM
6AM
NOON
6PM
12AM
May 7
+0000
May 8
Full Forecast
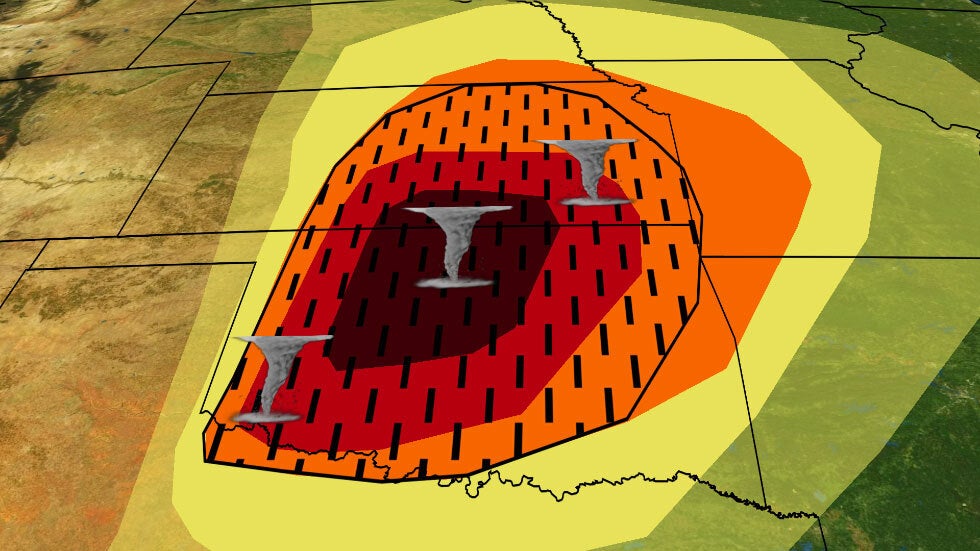
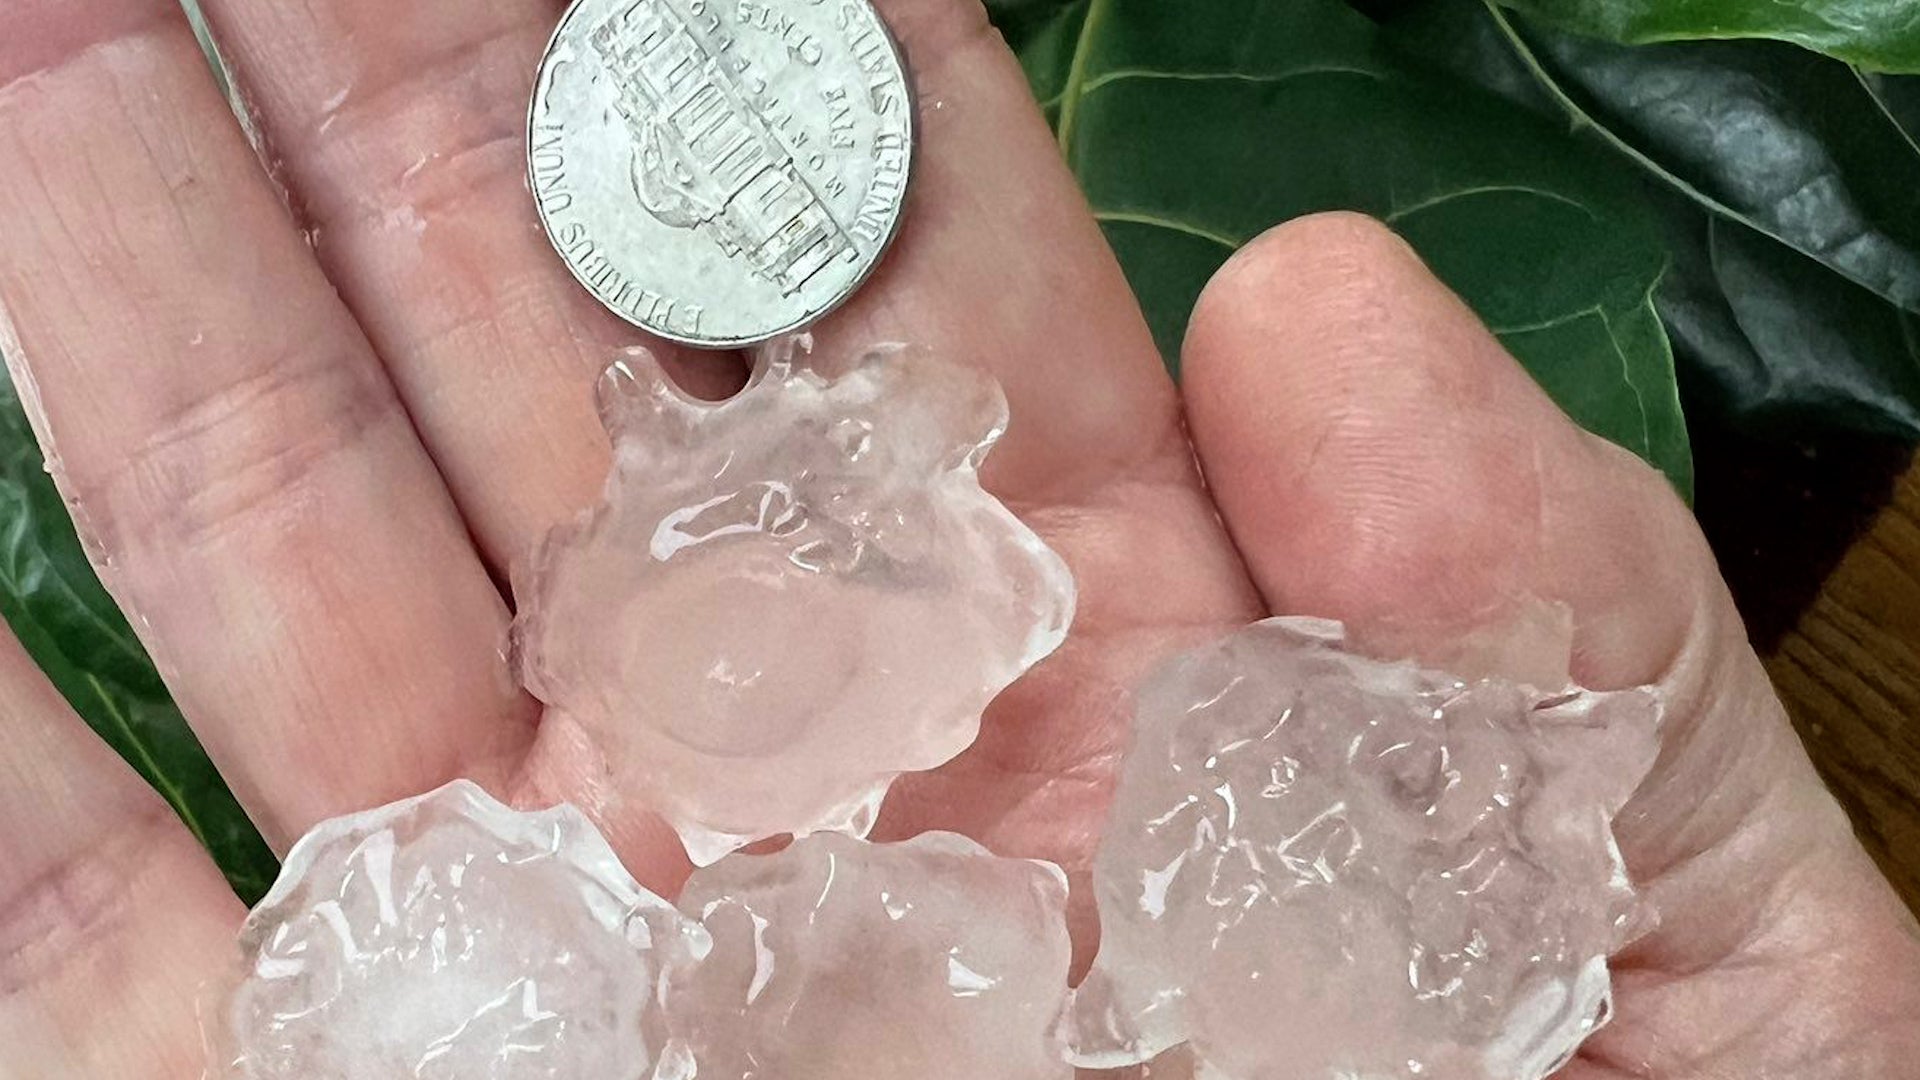
Rare Severe ‘High Risk’; Golf-Ball Size Hail, Tornado Watches Issued
Another widespread bout of severe thunderstorms is expected this week in the Plains and Midwest. Here's a look at the forecast.
Rare Severe ‘High Risk’; Golf-Ball Size Hail, Tornado Watches Issued
Tornado Threat Expands; See Where The Danger Looms Overnight
Our latest updates as we tracked the serious tornado threat in the Plains.
Tornado Threat Expands; See Where The Danger Looms Overnight
Southeast Lashed By Severe Weather
Severe weather including tornadoes and hail raked the Southeast Monday afternoon as the Plains braced for a weather threat not seen in several years.
Southeast Lashed By Severe Weather
Highest-Level Severe Weather Threat Issued For Plains
The National Weather Service has issued its highest-level warning for severe weather Monday as a possible tornado outbreak loomed in the Plains.
Highest-Level Severe Weather Threat Issued For Plains
What 'High Risk' Severe Weather Outlooks Mean; How To Prepare
Here's why a level 5 "high risk" severe weather forecast deserves your attention.
What 'High Risk' Severe Weather Outlooks Mean; How To Prepare
Please enable JavaScript to continue using this application.