Skip to Main Content
_
Sensor Network
Maps & Radar
Severe Weather
News & Blogs
Mobile Apps
More
Search
close
gps_fixed
gps_fixed
Find Nearest Station
Manage Favorite Cities
Log In
Go Ad Free
account_box
Log in
Go Ad Free
settings
Settings
Sensor Network
Maps & Radar
Severe Weather
News & Blogs
Mobile Apps
Historical Weather
star
Current Weather for
Popular
Cities
San Francisco, CA
warning
64
°
F
Sunny
Manhattan, NY
75
°
F
Sunny
Schiller Park, IL (60176)
warning
73
°
F
Mostly Cloudy
Boston, MA
68
°
F
Fair
Houston, TX
warning
85
°
F
Cloudy
St James's, England, United Kingdom
57
°
F
Clear
Search
close
gps_fixed
gps_fixed
Find Nearest Station
Manage Favorite Cities
settings
warning
Active Advisory
:
Small Craft Advisory
(
See More
)
--
Feels like
--
--
--
/
--
--
--
--
--
--
--
--
--
--
12AM
6AM
NOON
6PM
12AM
May 7
+0000
May 8
Full Forecast
Dangerous Weather Pushes Ahead; See When, Where The Risk Is
Another widespread bout of severe thunderstorms is spreading through the Midwest, South and East this week. Here's a look at the forecast.
Dangerous Weather Pushes Ahead; See When, Where The Risk Is
Oklahoma Tornadoes Leave 1 Dead Amid Widespread Damage
Multiple towns are heavily damaged in the Plains after a powerful round of severe storms struck the region. Here's the latest.
Oklahoma Tornadoes Leave 1 Dead Amid Widespread Damage
After Shocking Video Sparked Outrage, Teens Turn Themselves In
Two teens accused of dumping trash into the Atlantic Ocean near the Boca Raton Inlet have turned themselves in to authorities, facing a fine up to $50,000, five years in jail or both.
After Shocking Video Sparked Outrage, Teens Turn Themselves In
Popular Mosquito Repellent Does Next To Nothing
Scientists say these products don't work at all to prevent mosquitoes. And, conversely, here’s what does help.
Popular Mosquito Repellent Does Next To Nothing
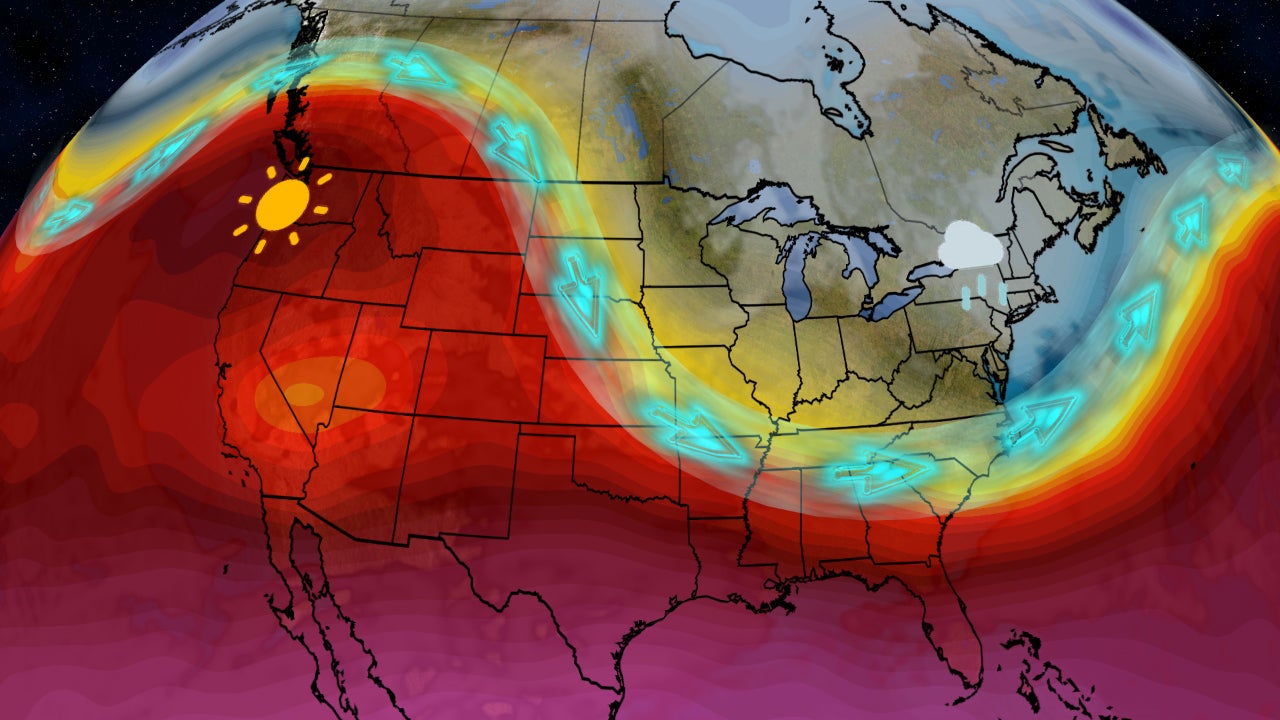
Pattern Change Ahead; What That Means For Your Forecast
Feel like your weather has been stuck in a rut? Here are the changes ahead.
Pattern Change Ahead; What That Means For Your Forecast
Please enable JavaScript to continue using this application.