Skip to Main Content
_
Sensor Network
Maps & Radar
Severe Weather
News & Blogs
Mobile Apps
More
Search
close
gps_fixed
gps_fixed
Find Nearest Station
Manage Favorite Cities
Log In
Go Ad Free
account_box
Log in
Go Ad Free
settings
Settings
Sensor Network
Maps & Radar
Severe Weather
News & Blogs
Mobile Apps
Historical Weather
star
Current Weather for
Popular
Cities
San Francisco, CA
69
°
F
Sunny
Manhattan, NY
63
°
F
Fair
Schiller Park, IL (60176)
75
°
F
Mostly Cloudy
Boston, MA
50
°
F
Mostly Cloudy
Houston, TX
warning
81
°
F
Cloudy
St James's, England, United Kingdom
warning
57
°
F
Clear
Search
close
gps_fixed
gps_fixed
Find Nearest Station
Manage Favorite Cities
settings
--
Feels like
--
--
--
/
--
--
--
--
--
--
--
--
--
--
12AM
6AM
NOON
6PM
12AM
May 1
+0000
May 2
Full Forecast
Shocking Video Of Boaters Sparks Outrage
Outrage grows after video of boaters behaving badly during Boca Bash gets posted online.
Shocking Video Of Boaters Sparks Outrage
System Could Ignite Severe Storms Again Today
True to spring's nature, another round of severe weather is affecting the Plains and Midwest. Here's what to know.
System Could Ignite Severe Storms Again Today
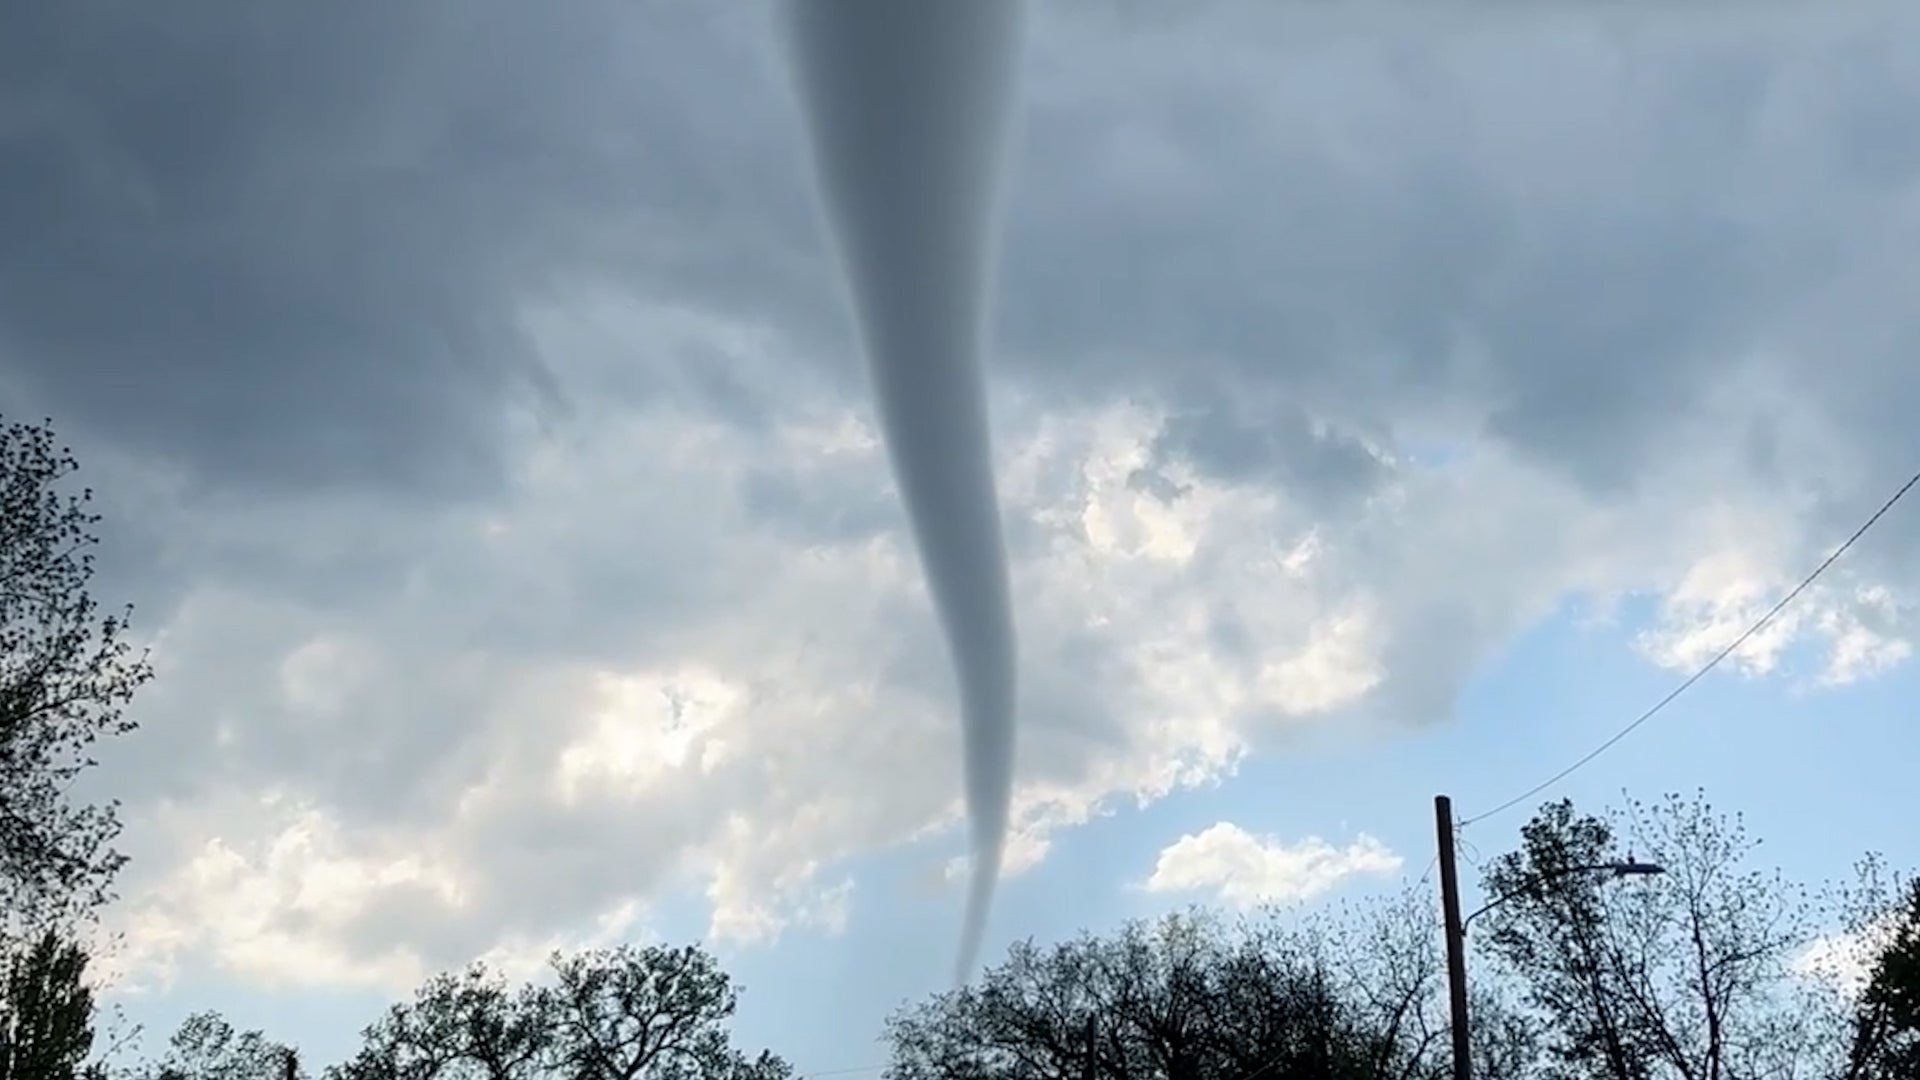
Shocking Video Captures Kansas Tornado Twists, Turns Near Gas Station
A man who says he was just grabbing a soda at the gas station ended up capturing heart-stopping video of the deadly tornado that tore through a city in northeast Kansas. Watch as he tracks the tornado’s twists and turns.
Shocking Video Captures Kansas Tornado Twists, Turns Near Gas Station
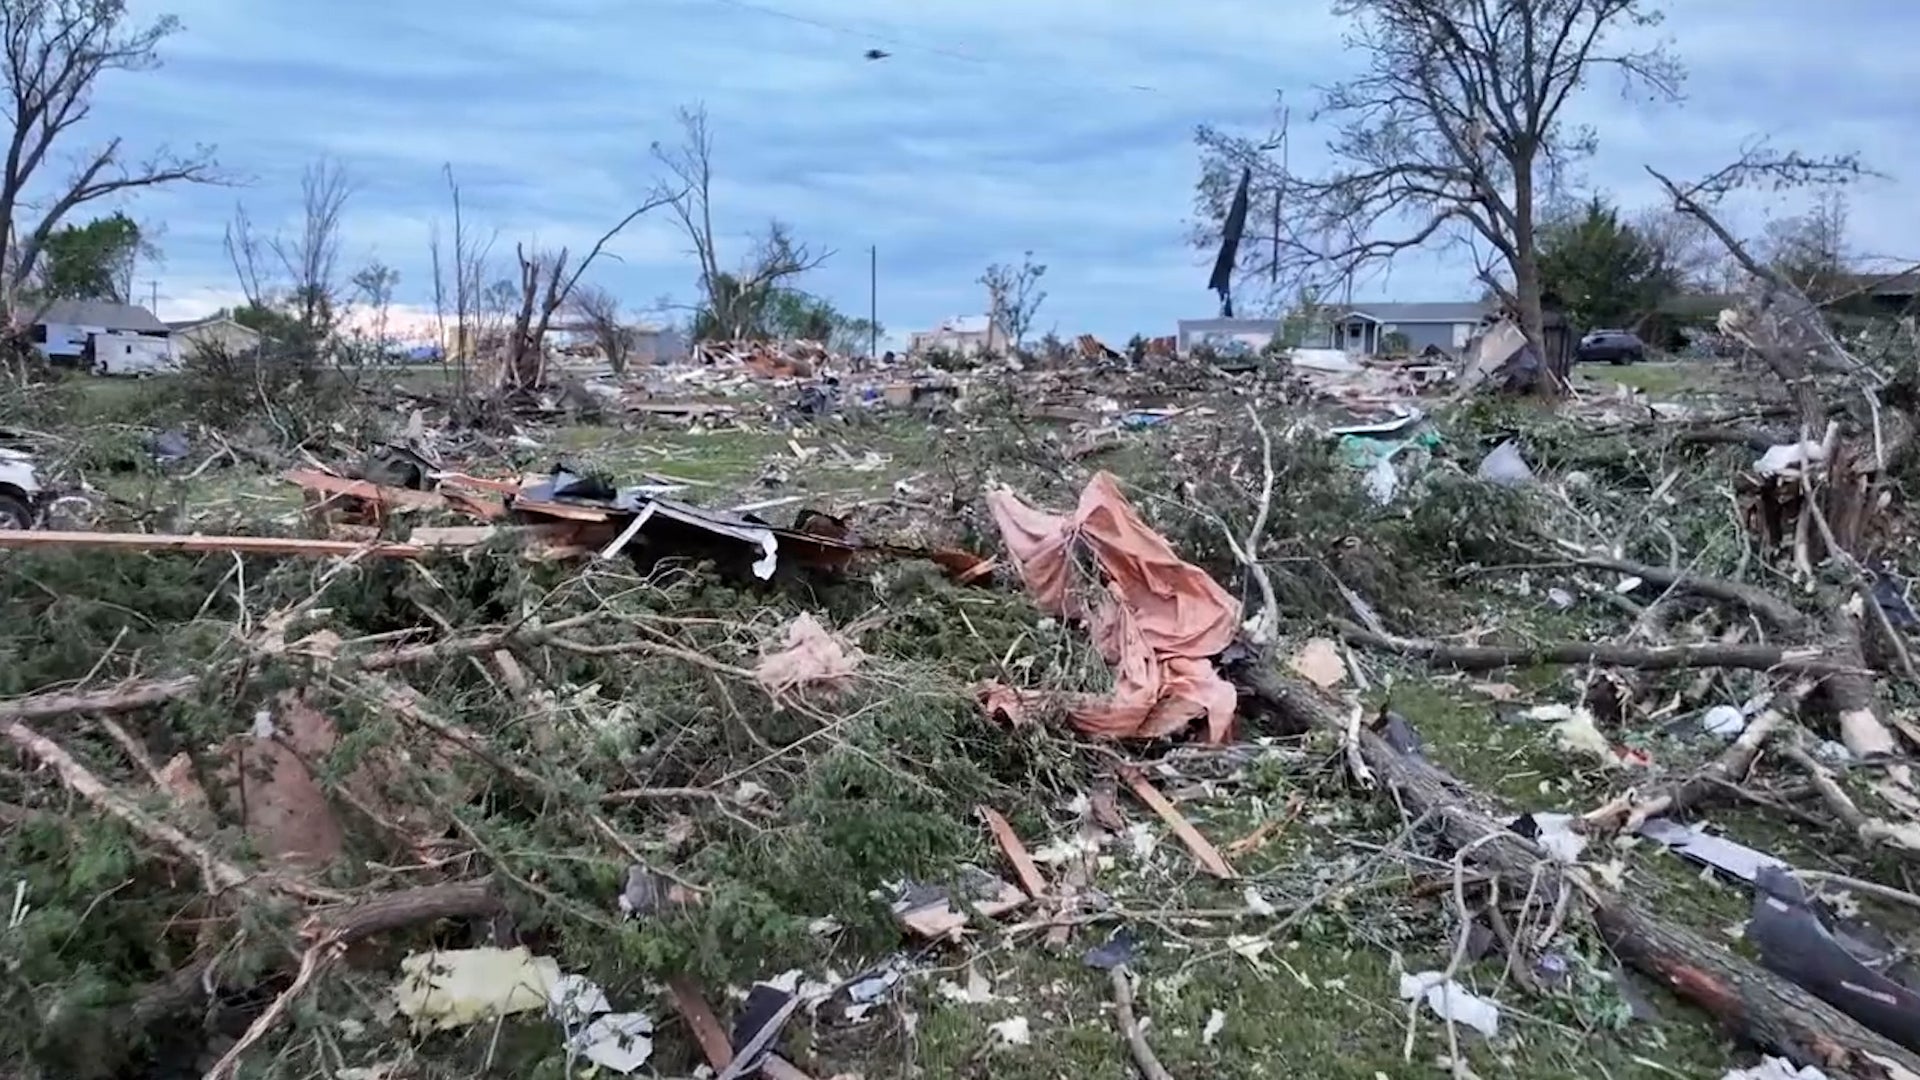
Drone Surveys What Little Remains Of Small Town
Aerial footage reveals catastrophic tornado damage in the small northeastern Kansas town of Westmoreland after Tuesday afternoon’s storm.
Drone Surveys What Little Remains Of Small Town
Child's 'Monster' Turns Out To Be Homeowner's Nightmare
A toddler's innocent claim of “monsters” in her bedroom unraveled a chilling discovery in a family’s century-old farmhouse.
Child's 'Monster' Turns Out To Be Homeowner's Nightmare
Please enable JavaScript to continue using this application.