Skip to Main Content
_
Sensor Network
Maps & Radar
Severe Weather
News & Blogs
Mobile Apps
More
Search
close
gps_fixed
gps_fixed
Find Nearest Station
Manage Favorite Cities
Log In
Go Ad Free
account_box
Log in
Go Ad Free
settings
Settings
Sensor Network
Maps & Radar
Severe Weather
News & Blogs
Mobile Apps
Historical Weather
star
Current Weather for
Popular
Cities
San Francisco, CA
warning
55
°
F
Fair/Wind
Manhattan, NY
48
°
F
Clear
Schiller Park, IL (60176)
warning
58
°
F
Cloudy
Boston, MA
47
°
F
Clear
Houston, TX
77
°
F
Cloudy
St James's, England, United Kingdom
45
°
F
Rain
Search
close
gps_fixed
gps_fixed
Find Nearest Station
Manage Favorite Cities
settings
warning
Active Advisory
:
Small Craft Advisory
(
See More
)
--
Feels like
--
--
--
/
--
--
--
--
--
--
--
--
--
--
12AM
6AM
NOON
6PM
12AM
Apr 27
+0000
Apr 28
Full Forecast
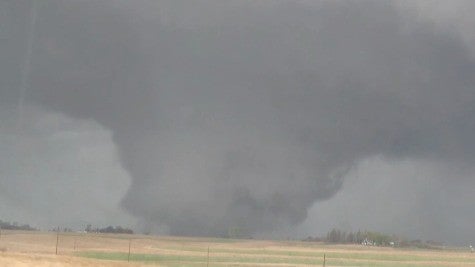
Several Tornadoes Across Multiple States; Scenes Of Devastation In Omaha Suburb
Tornadoes and damaging severe weather moved across parts of the Plains Friday.
Several Tornadoes Across Multiple States; Scenes Of Devastation In Omaha Suburb
Severe Outbreak Could Produce Strong Tornadoes Into The Weekend
A classic springtime ignite widespread severe storms through the weekend. Here's what to know.
Severe Outbreak Could Produce Strong Tornadoes Into The Weekend
White-Knuckle Video Of Tornadoes In Texas
A series of tornadoes ravaged parts of Texas, ripping through homes, snapping utility poles and leaving thousands of people without power.
White-Knuckle Video Of Tornadoes In Texas
Tornado Growth Captured Live On The Weather Channel
Several tornadoes were reported late Friday afternoon in Iowa.
Tornado Growth Captured Live On The Weather Channel
Violent Tornado Tears Across Interstate In Nebraska
The afternoon sky turned dark as tornadoes and strong storms plowed through southeast and central Nebraska on Friday.
Violent Tornado Tears Across Interstate In Nebraska
Please enable JavaScript to continue using this application.